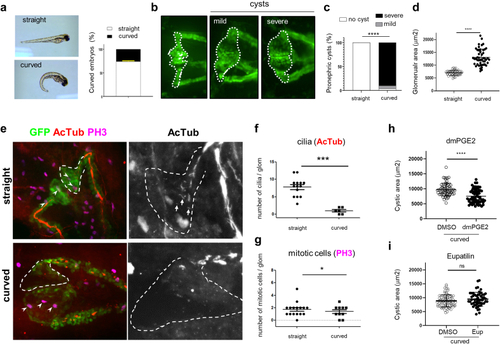
PGE2, but not Eupatilin, shows beneficial effect on cysts size in traf3ip1 mutant fish. (a) Representative pictures obtained after crossing m649-GFP fish (48 hpf) with an example of straight (up) and curved (down) embryos. The curvature phenotype was quantified (n = 8 experiments). (b) Representative pictures of the GFP-expressing pronephros with, from left to right: wild-type, mild (unilateral or small), or severe (bilateral) cystic pronephros. The region of the pronephros used to quantify the cyst area is indicated by a dotted white line. (c) Quantification of cyst severity score in straight and curved embryos (n = 4 experiments, chi-square test: ∗∗∗∗P < 0.0001). (d) Quantification of cyst area measured as explained in (b) for straight and curved embryos (n = 4 experiments; unpaired t test with Welch's correction: ∗∗∗∗P < 0.0001; error bars representing mean ± SD. (e) Straight (upper panels) and curved (lower panels) m649-GFP embryos were fixed and stained for cilia (acetylated-αtubulin, AcTub; red) and mitotic cells (phospho-histone-H3, PH3; purple). Representative color images are shown on the left. The areas surrounded by dotted lines represent one side of the glomerulus with the initial part of the proximal tubule based on GFP staining. On the right, zoomed (×2.33) views of the same samples are shown for AcTub only. White arrowheads on the left and arrows on the right pictures indicate mitotic cells and cilia, respectively. Scale bars: 20μm. (f) Quantification of cilia number per glomerulus for straight and curved embryos. Unpaired t test with Welch’s correction: ∗∗∗∗ P < 0.0001. (g) Quantification of mitotic cells number per glomerular region for straight and curved embryos. Mann-Whitney test: ∗P < 0.05. (h and i) m649-GFP embryos were treated with DMSO, dimethyl-PGE2 (dmPGE2; 100 μM), or Eupatilin (2.5 μM) starting at 24 hpf. Quantification of the effects of treatments on cyst area (dmPGE2: Mann-Whitney test; ∗∗∗∗P < 0.0001; Eupatilin: unpaired t test with Welch’s correction: ns P > 0.05). DMSO, dimethyl sulfoxide; EUP, Eupatilin.
|
