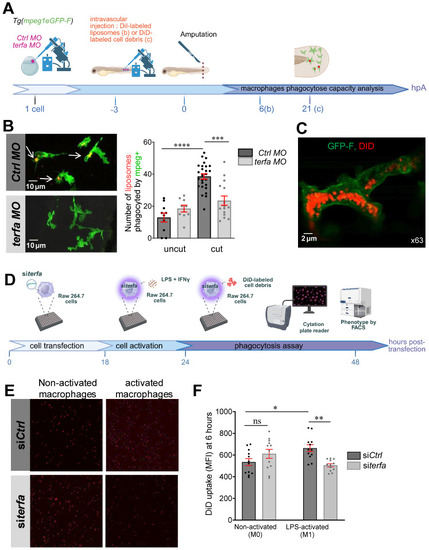
terfa knockdown impairs the phagocytic potential of zebrafish and mouse macrophages. (A) Experimental design: injection of terfa morpholino (terfa MO) or control morpholino (ctrl MO) at the 1-cell stage. Injection of DiI-labeled liposomes (or DiD-labeled cell debris) 3 hours before caudal fin amputation. Analysis of macrophage phagocytic activity by confocal microscopy at 6 hpA (for the DiD-labeled cell debris) and at 24 hpA (for DiI-labeled liposomes). (B) Confocal maximum projections of the fluorescence signal of DiI-labeled liposomes (red) and GFP-labeled macrophages (green) in Tg(mpeg1:eGFP) terfa and ctrl morphants at 24 hpA. White arrows indicate liposomes phagocytosed by macrophages (left panels). The graph shows the quantification of phagocytosed liposomes in the caudal fin (mean ± SEM, n = 10 larvae for both uncut group, n = 26 larvae for the amputated ctrl MO group and n = 15 larvae for the amputated terfa MO group) (right panel); **** p < 0.0001, *** p < 0.001 (Kruskal-Wallis test). (C) Confocal maximum projection analysis of DiD-labeled cell debris (red) fluorescence in one GFP-labeled macrophage (green). (D) Mouse RAW 264.7 macrophages (28,000 cells per well) were seeded in a multi-well plate. After 6 hours, cells were transfected with 20 nM of siRNA targeting terfa for 18 hours. Then, cells were activated (M1) or not (M0) with LPS (250 ng/mL) + IFNγ (20 ng/mL) for 6 hours, followed by DiD-labeled cell debris addition. Cell debris uptake was assessed using the Cytation 5 plate reader for 24 hours. (E) Representative images showing the fluorescence intensity indicative of macrophages that have phagocytosed DiD-labeled debris at 6 hours after debris addition. (F) Quantitative analysis of fluorescence intensity. Data are the mean fluorescence intensity ± SEM at 6 hours; n=3; **p<0.01, *p<0.1 (1 way ANOVA, Tukey test, with multiple comparisons).
|
