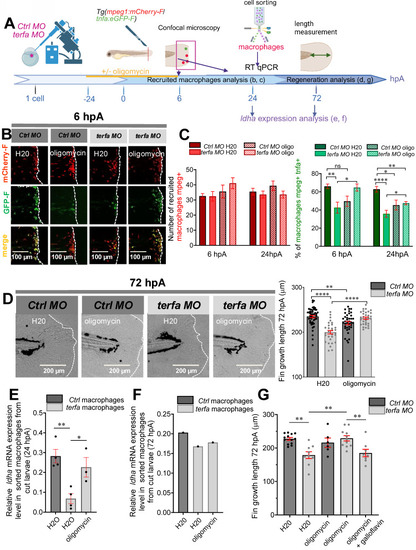
Oligomycin restores the macrophage response and regenerative potential in terfa morphants. (A) Experimental design: injection of terfa morpholino (terfa MO) or control morpholino (ctrl MO) at the 1-cell stage in the transgenic line Tg(mpeg1:mcherry-F; tnfa:eGFP-F). Amputation of the caudal fin fold at 72 hpf (corresponding to 0 hpA in the workflow). Oligomycin was added to the fish water 24 hours before amputation and maintained in the medium until 6 hours post-amputation (6 hpA). The recruitment of macrophages was assessed at 6 and 24 hpA. Macrophage cell sorting was performed at 24 hpA and ldha expression in macrophages isolated from ctrl larvae and terfa morphants was analyzed by RT-qPCR at 24 hpA and 72 hpA. Finally, fin regrowth was measured at 72 hpA. (B) Representative images of confocal maximal projections of Tg(mpeg1:mcherry-F/tnfa:eGFP-F) ctrl or terfa morphants' caudal fin at 6 hpA. Zebrafish larvae were incubated or not (H2O) with oligomycin (oligo) from 48 hpf to 6 hpA. (C) In red, number of mpeg+ macrophages recruited at the wound site in treated (oligo) and untreated (H2O) ctrl MO (dark red) and terfa MO (light red) larvae at 6 and 24 hpA (upper panel). In green, percentage of tnfa+ macrophages recruited to the wound site in treated (oligo) and untreated (H2O) ctrl MO (dark green) and terfa MO (light green) larvae at 6 and 24 hpA. Data are the mean ± SEM, 10 < n < 20 larvae for each condition; **** p < 0.0001, ** p < 0.01 and * p < 0.1 (Tukey's multiple comparisons test). (D) Bright-field images of the regenerating caudal fin of treated (oligomycin) and untreated (H2O) terfa or ctrl morphants at 72 hpA. The graph shows the fin regrowth length (mean ± SEM); 30 < n < 51 larvae per condition; **** p < 0.0001, ** p < 0.01 (1 way ANOVA, Tukey test, with multiple comparisons). (E) Relative expression level of ldha (relative to ef1a) in sorted macrophages of treated (oligomycin) and untreated (H2O) terfa or ctrl morphants at 24 hpA (data are the mean ± SEM, 3 < n < 4 independent experiments ** p < 0.01 * p < 0.01 (1 way ANOVA, Tukey test, with multiple comparisons). (F) Relative expression level of ldha (relative to ef1a) in sorted macrophages of treated (oligomycin) and untreated (H20) terfa or ctrl morphants at 72 hpA (one experiment). (G) The graph shows the fin regrowth length (mean ± SEM) at 72 hpA, ctrl morphants and terfa morphants were incubated either in water (H₂O), in oligomycin, or in oligomycin combined with galloflavin. ** p < 0.01 (1 way ANOVA, Tukey test, with multiple comparisons).
|