FIGURE SUMMARY
Title

Disrupted macrophage metabolic adaptation and function drive senescence-induced decline in vertebrate regeneration

Authors
Barthelaix, A., Terraza-Aguirre, C., Río-Jay, Y.D., Bohaud, C., Salvador, J., Morille, M., Ferreira, M.G., Jorgensen, C., Djouad, F.
Source
Full text @ Theranostics

terfa knockdown does not affect the development of zebrafish larvae. (A) Experimental design: injection of terfa morpholino (terfa MO) or control morpholino (ctrl MO) at the 1-cell stage. The senescence phenotype was analyzed at 72 h post-fertilization (hpf) by immunofluorescence and at 78 hpf by RT-qPCR. Fin development and function were analyzed by measuring fin length at 144 hpf and zebrafish locomotion and activity at 120 hpf, respectively. (B) Confocal images of immunofluorescence staining to assess ɣH2AX expression in the caudal fin of ctrl morphants (ctrl MO) and terfa morphants (terfa MO) at 72 hpf. The graph shows the quantification of ɣH2AX-positive cells in the caudal fin; data are the mean ± SEM, n = 15 larvae/group; ** p < 0.01 (Mann Whitney test). (C) Relative cdkn2a/b (p15/16), cdkn1a (p21) and tp53 (p53) expression in the caudal fin of terfa MO and ctrl MO was assessed by RT-qPCR at 78 hpf. Ef1a was used as reference gene and data are the mean ± SEM (n = 14 independent experiments); **** p < 0.0001, *** p < 0.001, ** p < 0.01 (Mann Whitney test). (D) Representative images of zebrafish larvae at 144 hpf (left panels) and zoom on the caudal fin folds at 144 hpf (right panels). The graph shows the fin length (mean ± SEM) at 144 hpf in ctrl MO (n = 27) and terfa MO (n = 11) larvae; ns, not significant (Mann Whitney test). (E) Spontaneous locomotion analysis in ctrl and terfa morphants at 120 hpf. Quantification of the mobility period (left panel) and net velocity (middle panel) during locomotion; n = 24 ctrl MO and n = 24 terfa MO; ns, not significant (Mann Whitney test). On the right panel, the red and green trajectories correspond to fast and slow swimming, respectively.

terfa knockdown impairs regeneration in zebrafish larvae. (A) Experimental design: injection of terfa morpholino (terfa MO) or control morpholino (ctrl MO) at the 1-cell stage followed by caudal fin section at 72 hpf. Then, lin28 (blastemal marker) expression in the caudal fin was assessed by RT-qPCR at 6 hpA and 24 hpA. Caudal fin regeneration was monitored by measuring the regenerated caudal fin length and area at 72 hpA and by quantifying cell proliferation by immunofluorescence at 6, 24, 48 and 72 hpA. (B) Representative images of the amputated and regenerated caudal fins at 0 and 72 hpA, respectively (left panels). Graphs showing the caudal fin fold length (mean ± SEM) in ctrl and terfa morphants at 72 hpA (middle panel) and the fin area (mean ± SEM) in Ctrl and terfa morphants at 72 hpA (right panel); **** p < 0.0001, ** p < 0.01 (Mann Whitney test) (C) Relative lin28 expression in the caudal fin of ctrl and terfa morphants assessed by RT-qPCR at 6 and 24 hpA; ef1a was used as reference gene (data are the mean ± SEM, n = 8 and n = 9 independent experiments at 6 and 24 hpA, respectively); * p < 0.1 (Mann-Whitney test). (D) Quantification of cell proliferation in the regenerated caudal fin fold by assessing pH3 expression at 6, 24, 48 and 72 hpA; **** p < 0.0001 (Mann-Whitney test).

Wild-type circulating cells partially restore the regeneration potential in terfa morphants. (A) Schematic representation of parabiosis experiment using Tg(mpeg1:gal4/UAS:NTR-mcherry) larvae previously injected with terfa MO or ctrl MO and wild-type (WT) larvae. Conjoined embryos were generated at the shied stage. Macrophages in the morphant partner were depleted by injection of 10 mM metronidazole at 48hpf. The morphants' caudal fin folds were amputated at 72 hpf. Then, at 72 hpA, regeneration was analyzed by measuring the length of the regenerated caudal fin fold. (B) Representative images of conjoined embryos at 72 hpA. The middle panels show a zoom of the cut caudal fins. The right panels show a zoom of regenerated fins at 72 hpA. (C) Quantification of the regenerated caudal fin length at 72 hpA (data are the mean ± SEM, n = 11 Ctrl MO larvae, n = 3 terfa MO larvae).

terfa knockdown impairs the macrophage response following caudal fin amputation. (A) Experimental design: injection of terfa morpholino (terfa MO) or control morpholino (ctrl MO) at the 1-cell stage in the zebrafish transgenic line Tg(mpeg1:mCherry). Macrophages were isolated from both ctrl morphants and terfa morphants (100 larvae per condition) at 72hpf. The p15/16 expression level was measured and compared between the sorted macrophages and other cells populations (other cells), consisting of all non-macrophage cells from the zebrafish larva using qRT-PCR. (B) Relative mRNA expression levels of cdkn2a/b in the terfa morphants were assessed at 72 hpf by qRT-PCR. Ef1a was used as reference gene (data are the mean ± SEM, n = 6 independent experiments, Mann-Whitney tests were performed, p = 0.0649). (C) Relative mRNA expression level of cdkn2a/b in macrophages at 72hpf. Ef1a was used as reference gene (data are the mean ± SEM). * p < 0.1 (D) Experimental design: injection of terfa morpholino (terfa MO) or control morpholino (ctrl MO) at the 1-cell stage in Tg(mpeg1:mcherry-F/tnfa:eGFP-F) larvae. Caudal fins were amputated at 72 hpf and macrophage recruitment was analyzed from 3 to 72 hpA. (E) Representative images of maximal projections of caudal fin of Tg(mpeg1:mcherry-F/tnfa:eGFP-F) ctrl or terfa morphants at 24 hpA. All macrophages (mCherry-labeled) are in red and tnfa+ macrophages are in green. (F) Total number of macrophages (red) recruited to the wound area in ctrl (dark red) and terfa (pink) morphants at the indicated time points after amputation over 3 days (upper panel). Relative number of tnfa+ macrophages among all macrophages at the wound site in ctrl (dark green) and terfa (light green) morphants at different time points over 3 days. Data are the mean ± SEM, n = 50 larvae at 6, 24 and 48 hpA, n = 20 larvae at 19, 43 and 72 hpA, and n = 10 larvae at 3 hpA; **** p < 0.0001, * p < 0.1 (Tukey's multiple comparisons test).

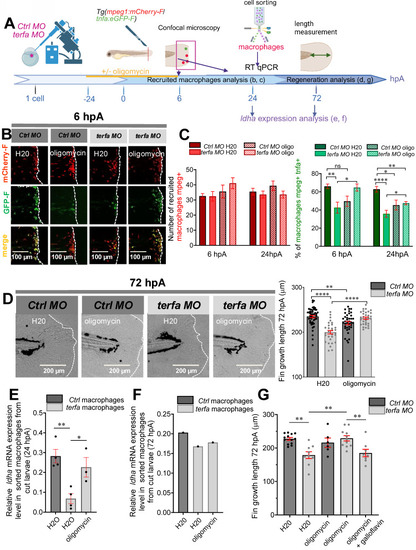
Oligomycin restores the macrophage response and regenerative potential in terfa morphants. (A) Experimental design: injection of terfa morpholino (terfa MO) or control morpholino (ctrl MO) at the 1-cell stage in the transgenic line Tg(mpeg1:mcherry-F; tnfa:eGFP-F). Amputation of the caudal fin fold at 72 hpf (corresponding to 0 hpA in the workflow). Oligomycin was added to the fish water 24 hours before amputation and maintained in the medium until 6 hours post-amputation (6 hpA). The recruitment of macrophages was assessed at 6 and 24 hpA. Macrophage cell sorting was performed at 24 hpA and ldha expression in macrophages isolated from ctrl larvae and terfa morphants was analyzed by RT-qPCR at 24 hpA and 72 hpA. Finally, fin regrowth was measured at 72 hpA. (B) Representative images of confocal maximal projections of Tg(mpeg1:mcherry-F/tnfa:eGFP-F) ctrl or terfa morphants' caudal fin at 6 hpA. Zebrafish larvae were incubated or not (H2O) with oligomycin (oligo) from 48 hpf to 6 hpA. (C) In red, number of mpeg+ macrophages recruited at the wound site in treated (oligo) and untreated (H2O) ctrl MO (dark red) and terfa MO (light red) larvae at 6 and 24 hpA (upper panel). In green, percentage of tnfa+ macrophages recruited to the wound site in treated (oligo) and untreated (H2O) ctrl MO (dark green) and terfa MO (light green) larvae at 6 and 24 hpA. Data are the mean ± SEM, 10 < n < 20 larvae for each condition; **** p < 0.0001, ** p < 0.01 and * p < 0.1 (Tukey's multiple comparisons test). (D) Bright-field images of the regenerating caudal fin of treated (oligomycin) and untreated (H2O) terfa or ctrl morphants at 72 hpA. The graph shows the fin regrowth length (mean ± SEM); 30 < n < 51 larvae per condition; **** p < 0.0001, ** p < 0.01 (1 way ANOVA, Tukey test, with multiple comparisons). (E) Relative expression level of ldha (relative to ef1a) in sorted macrophages of treated (oligomycin) and untreated (H2O) terfa or ctrl morphants at 24 hpA (data are the mean ± SEM, 3 < n < 4 independent experiments ** p < 0.01 * p < 0.01 (1 way ANOVA, Tukey test, with multiple comparisons). (F) Relative expression level of ldha (relative to ef1a) in sorted macrophages of treated (oligomycin) and untreated (H20) terfa or ctrl morphants at 72 hpA (one experiment). (G) The graph shows the fin regrowth length (mean ± SEM) at 72 hpA, ctrl morphants and terfa morphants were incubated either in water (H₂O), in oligomycin, or in oligomycin combined with galloflavin. ** p < 0.01 (1 way ANOVA, Tukey test, with multiple comparisons).

terfa knockdown impairs the phagocytic potential of zebrafish and mouse macrophages. (A) Experimental design: injection of terfa morpholino (terfa MO) or control morpholino (ctrl MO) at the 1-cell stage. Injection of DiI-labeled liposomes (or DiD-labeled cell debris) 3 hours before caudal fin amputation. Analysis of macrophage phagocytic activity by confocal microscopy at 6 hpA (for the DiD-labeled cell debris) and at 24 hpA (for DiI-labeled liposomes). (B) Confocal maximum projections of the fluorescence signal of DiI-labeled liposomes (red) and GFP-labeled macrophages (green) in Tg(mpeg1:eGFP) terfa and ctrl morphants at 24 hpA. White arrows indicate liposomes phagocytosed by macrophages (left panels). The graph shows the quantification of phagocytosed liposomes in the caudal fin (mean ± SEM, n = 10 larvae for both uncut group, n = 26 larvae for the amputated ctrl MO group and n = 15 larvae for the amputated terfa MO group) (right panel); **** p < 0.0001, *** p < 0.001 (Kruskal-Wallis test). (C) Confocal maximum projection analysis of DiD-labeled cell debris (red) fluorescence in one GFP-labeled macrophage (green). (D) Mouse RAW 264.7 macrophages (28,000 cells per well) were seeded in a multi-well plate. After 6 hours, cells were transfected with 20 nM of siRNA targeting terfa for 18 hours. Then, cells were activated (M1) or not (M0) with LPS (250 ng/mL) + IFNγ (20 ng/mL) for 6 hours, followed by DiD-labeled cell debris addition. Cell debris uptake was assessed using the Cytation 5 plate reader for 24 hours. (E) Representative images showing the fluorescence intensity indicative of macrophages that have phagocytosed DiD-labeled debris at 6 hours after debris addition. (F) Quantitative analysis of fluorescence intensity. Data are the mean fluorescence intensity ± SEM at 6 hours; n=3; **p<0.01, *p<0.1 (1 way ANOVA, Tukey test, with multiple comparisons).

Acknowledgments
This image is the copyrighted work of the attributed author or publisher, and ZFIN has permission only to display this image to its users. Additional permissions should be obtained from the applicable author or publisher of the image. Full text @ Theranostics