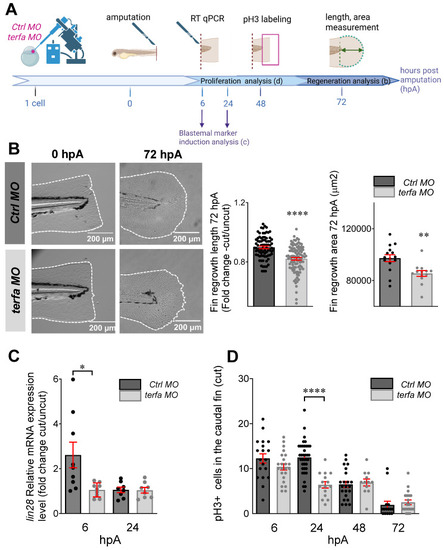
terfa knockdown impairs regeneration in zebrafish larvae. (A) Experimental design: injection of terfa morpholino (terfa MO) or control morpholino (ctrl MO) at the 1-cell stage followed by caudal fin section at 72 hpf. Then, lin28 (blastemal marker) expression in the caudal fin was assessed by RT-qPCR at 6 hpA and 24 hpA. Caudal fin regeneration was monitored by measuring the regenerated caudal fin length and area at 72 hpA and by quantifying cell proliferation by immunofluorescence at 6, 24, 48 and 72 hpA. (B) Representative images of the amputated and regenerated caudal fins at 0 and 72 hpA, respectively (left panels). Graphs showing the caudal fin fold length (mean ± SEM) in ctrl and terfa morphants at 72 hpA (middle panel) and the fin area (mean ± SEM) in Ctrl and terfa morphants at 72 hpA (right panel); **** p < 0.0001, ** p < 0.01 (Mann Whitney test) (C) Relative lin28 expression in the caudal fin of ctrl and terfa morphants assessed by RT-qPCR at 6 and 24 hpA; ef1a was used as reference gene (data are the mean ± SEM, n = 8 and n = 9 independent experiments at 6 and 24 hpA, respectively); * p < 0.1 (Mann-Whitney test). (D) Quantification of cell proliferation in the regenerated caudal fin fold by assessing pH3 expression at 6, 24, 48 and 72 hpA; **** p < 0.0001 (Mann-Whitney test).
|
