
Fig. 4
- ID
- ZDB-FIG-250529-9
- Publication
- Matsumata et al., 2025 - The habenula-interpeduncular nucleus-median raphe pathway regulates the outcome of social dominance conflicts in mice
- Other Figures
- All Figure Page
- Back to All Figure Page
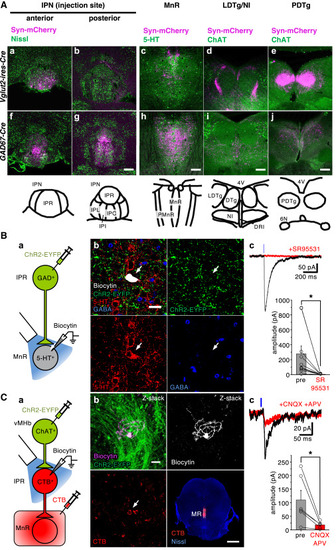
The vMHb-IPN pathway directly downregulates 5-HT neuronal activity in the median raphe (A) Projections of neurons in the anterior part (a and f) and the posterior part (b and g) of IPN to their target areas, MnR (c and h), LDTg/NI (d and i), and PDTg (e and j). AAV-CBA-FLEX-synaptophysin-mCherry was injected into the IPN of Vglut2-ires-Cre (a–e) or GAD67-Cre (f–j) mice. Glutamatergic or GABAergic projection was anterogradely labeled by mCherry fluorescent, respectively. Immunohistochemistry images show glutamatergic (a–e) or GABAergic (f–j) projections (mCherry, magenta), whole neurons (Nissl, green) (a, b, f, and g), 5-HT neurons (green) (c and h), and cholinergic neurons (ChAT, green) (d, e, i, and j). Lower, schematic illustration of each nucleus. Scale bars, 200 μm. IPN, interpeduncular nucleus; IPR, interpeduncular nucleus, rostral subnucleus; IPC, interpeduncular nucleus, caudal subnucleus; IPL, interpeduncular nucleus, lateral subnucleus; IPI, interpeduncular nucleus, intermediate subnucleus; MnR, median raphe; PMnR, paramedian raphe; LDTg, laterodorsal tegmental nucleus; DTg, dorsal tegmental nucleus; NI, nucleus incertus; DRI, dorsal raphe, interfascicular part; PDTg, posterodorsal tegmental nucleus; 4V, 4th ventricle; 6N, 6th cranial nerve. (B) GABAergic projection from IPR to MnR. (a) Schematic illustration for studying connection from the IPR GABAergic projections to a MnR 5-HT neuron (see STAR Methods). (b) Immunohistochemistry showing that a biocytin-filled recorded neuron (white, top left) is positive for 5-HT (red, arrow in bottom left), but not for GABA (blue, arrow in bottom right), and is surrounded by EYFP-positive axon termini (green, top) of the IPR GABAergic neurons. Scale bar, 20 μm. See also Figure S2. (c) Optically evoked IPSC (black) recorded from a 5-HT neuron in MnR and its abolishment (red) by GABAAR blocker, SR95531. Blue vertical bar indicates the timing of illumination. Bar graph represents the amplitude of IPSCs pre (left column) and post application (right column) of SR95531 (n = 10 cells, p = 0.0283). (C) Cholinergic projection from vMHb to IPR directly connect to GABAergic projection from IPR to MnR. (a) Schematic illustration to prove connection of the vMHb cholinergic neurons (co-releasing glutamate) with the MnR-projecting IPR neurons (see STAR Methods). (b) Immunohistochemistry showing a biocytin-filled recorded neuron (white, top), labeled by CTB-555 (red, arrow in bottom left), injected in MnR (red, in bottom right), and surrounded by EYFP-positive axon termini (green, top left) of vMHb ChAT-positive glutamatergic neurons. Scale bars, 10 μm in upper panel, 1 mm in lower panel. (c) Optically evoked EPSC (black) recorded from an MnR-projecting IPR neuron and its abolishment (red) by GluR blocker cocktail, CNQX and APV. Blue vertical bar indicates the timing of illumination. Bar graph represents the amplitude of EPSCs pre (left column) and post application (right column) of CNQX and APV (n = 6 cells, p = 0.0338). Error bars in (Bc) and (Cc), mean ± the standard error of means (SEM). Paired t test was used for (Bc) and (Cc). Statistical significance was defined as ∗p < 0.05. |