
Fig. 5
- ID
- ZDB-FIG-250529-10
- Publication
- Matsumata et al., 2025 - The habenula-interpeduncular nucleus-median raphe pathway regulates the outcome of social dominance conflicts in mice
- Other Figures
- All Figure Page
- Back to All Figure Page
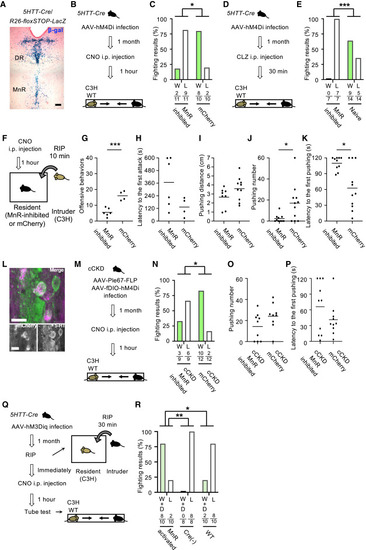
The vMHb-IPN pathway induces loser behavior via inhibition of MnR 5-HT neurons (A) The expression of Cre-recombinase in the DR and the MnR was detected by β-gal activity in 5HTT-Cre/R26-floxSTOP-LacZ mouse. Scale bar, 100 μm. (B) Schematic illustration of MnR-specific chemogenetic inhibition by CNO injection. All mice were forced to oppose the C3H background WT mouse. (C) Results of the tube test in the pairs of MnR-inhibited vs. C3H (n = 11 pairs) and mCherry vs. C3H mice (n = 10 pairs) (p = 0.0089). W, win; L, lose. (D) Schematic illustration of MnR-specific chemogenetic inhibition by CLZ injection. (E) Results of the tube test in the pairs of MnR-inhibited vs. C3H (n = 7 pairs) and naive control vs. C3H mice (n = 14 pairs) (p < 0.001). W, win; L, lose. (F) Schematic illustration of the RIP test with the MnR-inhibited mice or the mCherry-expressing mice as the resident and the C3H mice as the intruder. (G) The number of attacks by the resident MnR-inhibited (n = 6) or mCherry-expressing (n = 4) mice on the C3H mice (p < 0.001). (H) Latency to the first attack by the residents (p > 0.05). (I–K) The results of obstacle-pushing test. Comparison of maximum pushing distance (MnR-inhibited, n = 8; mCherry, n = 10, p > 0.05) (I), pushing number (MnR-inhibited, n = 10; mCherry, n = 11, p = 0.0214) (J), and latency to the first pushing (p = 0.0266) (K). (L) Expressions of hM4Di in 5-HT neurons in the MnR of cCKD mouse. Signals of hM4Di-mCherry (magenta) and 5-HT antibody (green) were overlapped on 5-HT neurons in the MnR of cCKD mouse. Scale bars, 20 μm. (M) Schematic illustration of MnR-inhibited cCKD mouse by CNO injection. All mice were forced to oppose the C3H background WT mouse. (N) Results of the tube test in the pairs of MnR-inhibited cCKD vs. WT C3H (n = 9 pairs) and mCherry-expressing cCKD mice vs. C3H mice (n = 12 pairs) (p = 0.0318). W, win; L, lose. (O and P) The results of obstacle-pushing test. Comparison of pushing number (MnR-inhibited cCKD, n = 9; mCherry cCKD, n = 9, p > 0.05) (O) and latency to the first pushing (MnR-inhibited cCKD, n = 10; mCherry cCKD, n = 10, p > 0.05) (P). (Q) Schematic illustration of the MnR 5-HT activation in RIP defeated mice, followed by tube tests with the C3H mice. See also Figure S3. (R) Results of the tube test in the pairs of MnR-activated (hM3Dq expressed with CNO injection) vs. C3H (n = 10 pairs), Cre(−) (5HTT-Cre(−) with CNO injection) vs. C3H (n = 8 pairs), and WT (hM3Dq expression vector was injected, but not expressed, because of Cre lack with CNO injection) vs. C3H mice (n = 10 pairs) (MnR-activated vs. Cre(−), p = 0.0011; MnR-activated vs. WT, p = 0.0230). W, win; L, lose; D, draw. Bars, mean. Fisher’s exact test was used for detection of the differences in the winning ratio in all tube test analyses. In other comparisons, unpaired t test was used for all statistical analyses except for (J) and (K). Mann-Whitney test was used for (J) and (K) because the variance deviated from the normal distribution. Statistical significance was defined as ∗p < 0.05, ∗∗p < 0.01, and ∗∗∗p < 0.001. |