
Fig. 1
- ID
- ZDB-FIG-250529-6
- Publication
- Matsumata et al., 2025 - The habenula-interpeduncular nucleus-median raphe pathway regulates the outcome of social dominance conflicts in mice
- Other Figures
- All Figure Page
- Back to All Figure Page
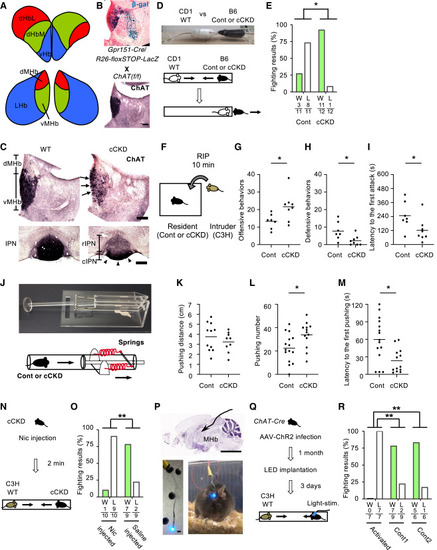
Cholinergic transmission in the vMHb-IPN pathway prompts losing in social conflict (A) Schematic illustration of the subnuclei in zebrafish and mouse Hb. (B) Mice breeding scheme. The expression of Cre-recombinase (upper; detected by β-gal activity in Gpr151-Cre/R26-floxSTOP-LacZ mouse) and ChAT (lower; in WT mouse) in the Hb are shown. Scale bar, 100 μm. (C) Expressions of ChAT in the Hb and the IPN of a WT (left) and cCKD (right) mouse. ChAT expression was highly reduced in the vMHb and the rIPN, and remaining ChAT-positive neurons along the medial edge of the vMHb (arrow) mainly projected to the cIPN (arrowhead) in cCKD mouse. Scale bars, 100 μm (upper) or 200 μm (lower). (D) Schematic photo and illustration of the tube test. The Cont or cCKD mouse (black; C57BL/6 background) was forced to oppose a bigger mouse (white; CD1 background). (E) The results of the tube test in the pairs of Cont vs. CD1 (n = 11 pairs) and cCKD vs. CD1 mice (n = 12 pairs) (p = 0.0028). W, win; L, lose. See also Video S1. (F) Schematic illustration of the resident-intruder paradigm (RIP) test with the Cont or the cCKD mice as the resident and the C3H mice as the intruder. (G and H) The number of attacks by the resident Cont (n = 7) or cCKD (n = 8) on the C3H mice (p = 0.0305) (G) and of defensive behaviors by the resident Cont or cCKD (p = 0.0221) (H) in the RIP test depicted in (F). (I) Latency to the first attack by the residents (p = 0.0441). (J) The obstacle-pushing test. The apparatus of the obstacle-pushing test (upper) was inserted into plexiglas tubes. Schematic illustration of the obstacle-pushing test (lower). See also Video S2. (K–M) Comparison of maximum pushing distance (Cont, n = 11; cCKD, n = 9, p > 0.05) (K), pushing number (Cont, n = 15; cCKD, n = 13, p = 0.0159) (L), and latency to the first pushing (p = 0.0142) (M) for measurement of the motivation to push against the obstacles. (N) The cCKD mouse received a subcutaneous injection of nicotine from the back of the neck and was forced to oppose a docile mouse (brown; C3H background) 2 min after nicotine injection. Nic, nicotine. (O) The results of the tube test in the pairs of cCKD with nicotine vs. C3H mice (n = 10 pairs) and cCKD with saline vs. C3H mice (n = 9 pairs) (p = 0.0055). W, win; L, lose. (P) (Upper) Schematic illustration of LED implantation into the third ventricle. Scale bar, 5 mm. (lower, left) The optimized LED for implantation. Scale bar, 4 mm. (lower, right) The mouse receiving implantation surgery showed normal behaviors. See also Video S3. (Q) Schematic illustration of optogenetic activation by implanted LED. All mice were forced to oppose C3H background WT mice. (R) The results of the tube test in the pairs of activated (ChR2 expressed with LED lighting) vs. C3H (n = 7 pairs), Cont1 (EYFP expressed with LED lighting) vs. C3H (n = 9 pairs), and Cont2 (ChR2 expressed without LED lighting) vs. C3H mice (n = 6 pairs) (activated vs. Cont1, p = 0.0032; activated vs. Cont2, p = 0.0047). W, win; L, lose. See also Video S4. Bars, mean. Fisher’s exact test was used for detection of the differences in the winning ratio in all tube test analyses. In other comparisons, unpaired t test was used for all statistical analyses except for (M). Mann-Whitney test was used for (M) because the variance deviated from the normal distribution. Statistical significance was defined as ∗p < 0.05 and ∗∗p < 0.01. |