FIGURE

Figure 4.

ID
ZDB-FIG-250529-88
Publication
Collins et al., 2025 - Characterisation of transgenic lines labelling reticulospinal neurons in larval zebrafish
Other Figures
All Figure Page
Back to All Figure Page
Figure 4.

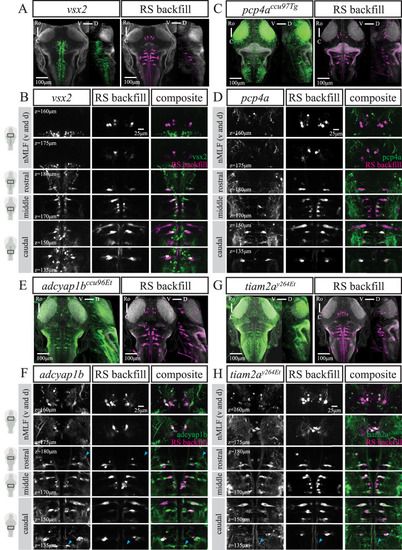
Reticulospinal cell labeling in four different transgenic lines. A, C, E, and G, MIPs from dorsal and sagittal views of an exemplary fish from A, vsx2 (n = 12), C, pcp4accu97Tg (n = 12), E, adcyap1bccu96Et (n = 11), and G, tiam2ay264Et (n = 12) at 6 dpf with RSNs labeled via retrograde dye injection. Scale bar is 100 μm. B, D, F, and H, Close ups at several planes to illustrate overlap between B, vsx2, D, pcp4accu97Tg, F, adcyap1bccu96Et, or H, tiam2ay264Et and RS backfill. Blue triangle in F, rostral panel indicates putative RoL1. Blue triangle in F and H, caudal panel indicates putative CaD and CaV cells. Scale bar is 25 μm.

Expression Data

Expression Detail
Antibody Labeling
Phenotype Data

Phenotype Detail
Acknowledgments
This image is the copyrighted work of the attributed author or publisher, and ZFIN has permission only to display this image to its users. Additional permissions should be obtained from the applicable author or publisher of the image. Full text @ eNeuro