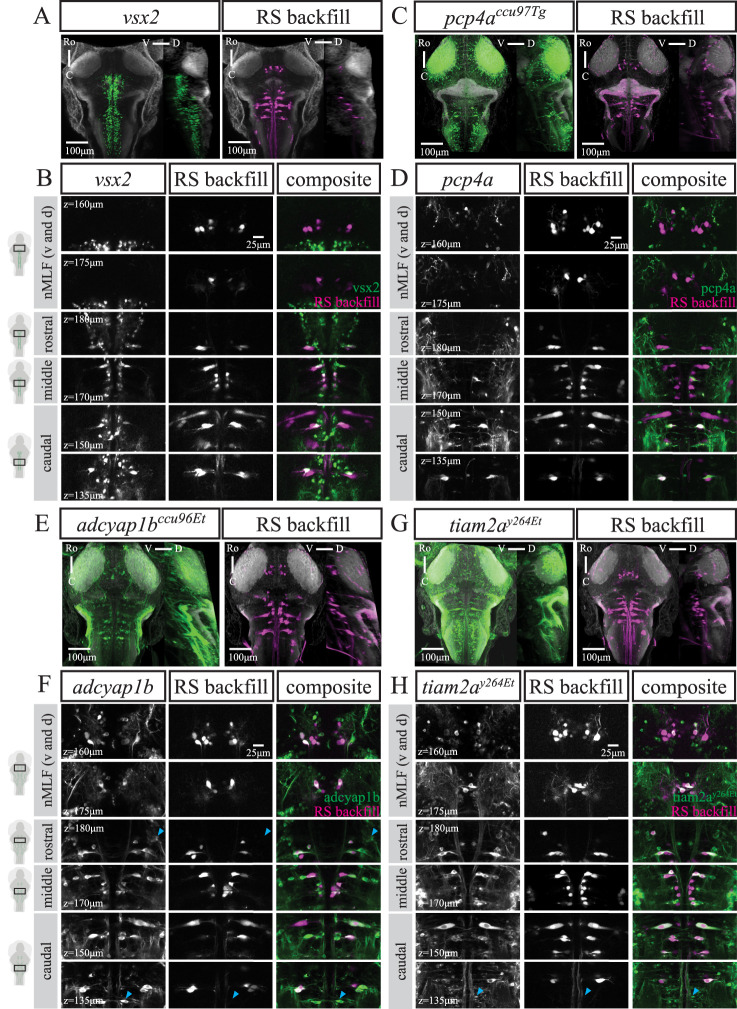
Reticulospinal cell labeling in four different transgenic lines. A, C, E, and G, MIPs from dorsal and sagittal views of an exemplary fish from A, vsx2 (n = 12), C, pcp4accu97Tg (n = 12), E, adcyap1bccu96Et (n = 11), and G, tiam2ay264Et (n = 12) at 6 dpf with RSNs labeled via retrograde dye injection. Scale bar is 100 μm. B, D, F, and H, Close ups at several planes to illustrate overlap between B, vsx2, D, pcp4accu97Tg, F, adcyap1bccu96Et, or H, tiam2ay264Et and RS backfill. Blue triangle in F, rostral panel indicates putative RoL1. Blue triangle in F and H, caudal panel indicates putative CaD and CaV cells. Scale bar is 25 μm.
Acknowledgments
This image is the copyrighted work of the attributed author or publisher, and
ZFIN has permission only to display this image to its users.
Additional permissions should be obtained from the applicable author or publisher of the image.
Full text @ eNeuro
Your Input Welcome
Thank you for submitting comments. Your input has been emailed to ZFIN curators who may contact you if
additional information is required.
Oops. Something went wrong. Please try again later.