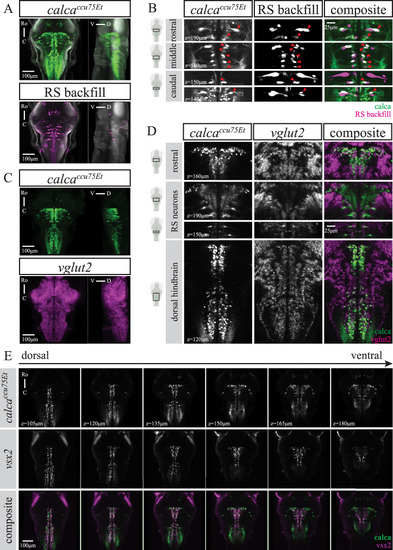
The calcaccu75Et line labels only IL-RSNs and closely matches the vsx2 line. A, MIPs from dorsal and sagittal views of an exemplary calcaccu75Et fish (of n = 12) at 6 dpf with RSNs labeled via retrograde dye injection. B, Close ups at several planes to illustrate overlap between calcaccu75Et line and backfill. Note that only IL-RSNs are present in calcaccu75Et as indicated by red triangles. C, MIPs from dorsal and sagittal views of an exemplary calcaccu75Et fish (of n = 8) at 6 dpf with vglut2 mRNA expression. D, Close ups at several planes to illustrate overlap between calcaccu75Et line and vglut2, particularly of the RSNs as well as a rostro-caudal glutamatergic (vglut2) stripe in the dorsal hindbrain. E, Single planes from dorsal (105 μm) to ventral (180 μm) at 15 μm intervals in calcaccu75Et, vsx2, and composite. For both top and middle panels, images are from two single fish (of n = 12 each) that were registered to a common reference brain (tERK). For A, C, and E, scale bar 100 μm, for B and D, scale bar 25 μm. For cholinergic (chata), GABAergic (gad1b/2), or glycinergic (glyt1 and glyt2) expression in neurons labeled by the calcaccu75Et line, see Extended data Figure 3-1.
|
