
Fig. 2
- ID
- ZDB-FIG-250528-2
- Publication
- Chen et al., 2025 - The combination of midkine inhibitor with Lenvatinib amplifies the suppression of hepatocellular carcinoma
- Other Figures
- All Figure Page
- Back to All Figure Page
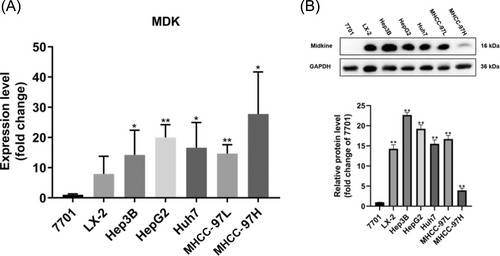
The expression levels of MDK in different HCC cell lines. (A) MDK expression at the mRNA level in normal hepatocytes 7701, hepatic stellate cells LX-2, and several HCC cell lines (Hep3B, HepG2, Huh7, MHCC-97 L, MHCC-97H). (B) Midkine protein levels were assessed in normal hepatocytes (7701), hepatic stellate cells (LX-2), and various HCC cell lines (Hep3B, HepG2, Huh7, MHCC-97 L, MHCC-97H). The grey values of the strips were quantified using ImageJ 2 software, defining the average grey value of hepatocyte 7701 as 1. Compare the significance of the difference between each group and 7701 using Student's t-test. Probability values p < .05 denote statistical differences, with statistical significance indicated by “*” for p < .05 and “**” for p < .01. Three independent replicate experiments were performed, four replicates per experiment for RT-qPCR and three replicate measurements per replicate for WB experiments. The results of quantification are presented as the mean ± SD. |