
- Title
-
The combination of midkine inhibitor with Lenvatinib amplifies the suppression of hepatocellular carcinoma
- Authors
- Chen, X., Guo, S., Meng, Q., Xie, J., Xiao, Y., Sun, Y., Yao, J., Jiang, X., Hong, A., Chen, X.
- Source
- Full text @ IUBMB Life
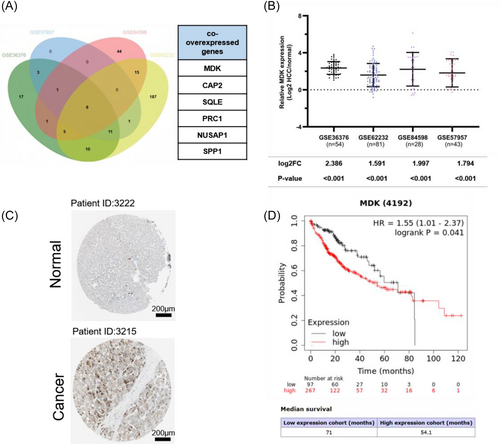
MDK exhibits high expression levels in HCC and correlates with unfavorable prognosis. (A) A Venn diagram is employed to analyze four liver cancer-related GEO databases (GSE36376, GSE57957, GSE62232, GSE84598) to identify upregulated genes with mRNA levels at least 1.5-fold higher than those in adjacent normal tissue. Six commonly upregulated differential genes were identified: MDK, CAP2, SQLE, PRC1, NUSAP1, and SPP1. (B) Relative expression levels of MDK genes across four GEO databases. (C) The IHC staining results of MDK protein in HCC tissues and normal tissues are sourced from the HPA database (https://www.proteinatlas.org/ENSG00000110492-MDK/pathology/liver+cancer#img). (D) The Kaplan–Meier plotter database provides statistical analysis of the correlation between MDK expression levels and prognosis in HCC tissues. |
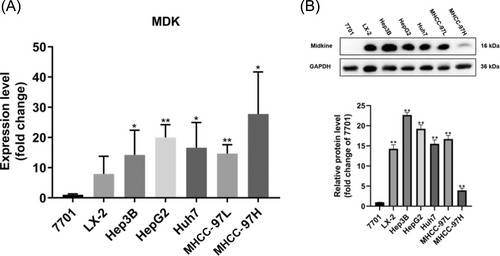
The expression levels of MDK in different HCC cell lines. (A) MDK expression at the mRNA level in normal hepatocytes 7701, hepatic stellate cells LX-2, and several HCC cell lines (Hep3B, HepG2, Huh7, MHCC-97 L, MHCC-97H). (B) Midkine protein levels were assessed in normal hepatocytes (7701), hepatic stellate cells (LX-2), and various HCC cell lines (Hep3B, HepG2, Huh7, MHCC-97 L, MHCC-97H). The grey values of the strips were quantified using ImageJ 2 software, defining the average grey value of hepatocyte 7701 as 1. Compare the significance of the difference between each group and 7701 using Student's t-test. Probability values p < .05 denote statistical differences, with statistical significance indicated by “*” for p < .05 and “**” for p < .01. Three independent replicate experiments were performed, four replicates per experiment for RT-qPCR and three replicate measurements per replicate for WB experiments. The results of quantification are presented as the mean ± SD. |

Inhibition of proliferation in HCC cells with reduced MDK expression. (A) Relative expression of MDK at the mRNA level in MHCC-97H cells after siRNA transfection. (B) Relative expression of MDK at the mRNA level in Huh7 cells after siRNA transfection. (C) Midkine protein levels in MHCC-97H cells after siRNA transfection. The grey values of the strips were quantified using ImageJ 2 software, defining the average grey value of siControl as 1. (D) Midkine protein levels in Huh7 cells after siRNA transfection. The grey values of the strips were quantified using ImageJ 2 software, defining the average grey value of siControl as 1. (E) Clone formation experiments were performed after the down-regulation of the MDK gene in MHCC-97H and Huh7 cells. The number of clonal clusters was quantified using ImageJ 2 software. (F) EdU staining experiments were conducted after the down-regulation of the MDK gene in MHCC-97H and Huh7 cell lines. Cells undergoing proliferation were marked with a green label, while nuclei were indicated with a blue label. The quantification of each fluorescent cell type was performed using ImageJ 2 software. (G) Following the knockdown of the MDK gene in MHCC-97H and Huh7 cells, the cells were subsequently cultured in 96-well plates. After a duration of 4 h, absorbances at 450 nm were measured using a microplate reader following CCK-8 staining. This measurement was recorded as the initial value on the first day. Absorbance readings were taken at 24-h intervals to assess cell viability. Compare the significance of the difference between each group and the siNC group using Student's t-test. Probability values p < .05 denote statistical differences, with statistical significance indicated by “*” for p < .05 and “**” for p < .01. Three independent replicate experiments were performed, four replicates per experiment for RT-qPCR and three replicate measurements per replicate for WB experiments. The quantification results are shown as the mean ± SD. |
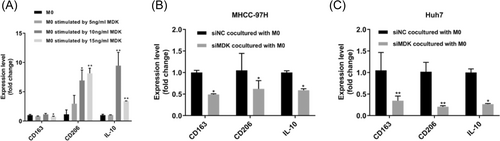
The inhibition of MDK enhances the immunosuppressive microenvironment in HCC. (A) Expression levels of CD163, CD206, and IL-10, which are indicative of macrophage M2 polarization, were assessed in M0 cells after a 72-h treatment with MDK factor. (B) Expression levels of CD163, CD206, and IL-10 were analyzed in Huh7 cells that were treated with siNC and siMDK, followed by transwell co-culture with M0 cells for 48 h. (C) Expression levels of CD163, CD206, and IL-10 were assessed in MHCC-97H cells treated with siNC and siMDK after a 48-h transwell co-culture with M0 cells. Compare the significance of the difference between each group and the M0 or siNC group using Student's t-test. Probability values p < .05 denote statistical differences, with statistical significance marked by “*” for p < .05 and “**” for p < .01. Three independent replicate experiments were performed, with four replicates for each experiment in RT-qPCR. The quantification results are presented as the mean ± SD. |
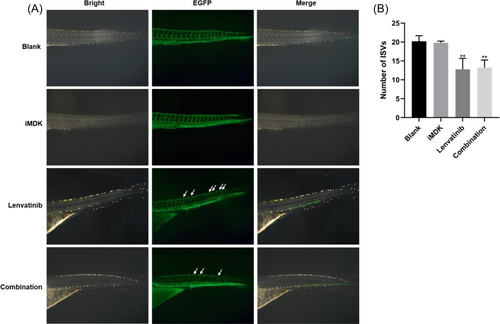
The detection of the inhibitory effect of the combination of iMDK and Lenvatinib on angiogenesis in zebrafish using fluorescence microscopy. (A) Zebrafish fertilized for three days were subjected to treatment in accordance with the control group and the administration groups, which included iMDK, Lenvatinib, and a combination of iMDK and Lenvatinib, with all inhibitor concentrations maintained at 1 μM. Images were obtained using a fluorescence microscope, where green fluorescence represented the zebrafish vasculature, while white arrows highlighted the intact ISVs. (B) Quantification of the numbers of ISVs in zebrafish to assess the inhibitory effect of iMDK, Lenvatinib, and their combination on these vessels. Compare the significance of the difference between each group and the blank group using Student's t-test. Probability values p < .05 denote statistical differences, with statistical significance marked by “*” for p < .05 and “**” for p < .01. Six individuals were included in each experimental group (n = 6). All these experiments were conducted three times in a double-blind manner, and the quantification results are presented as the mean ± SD. |
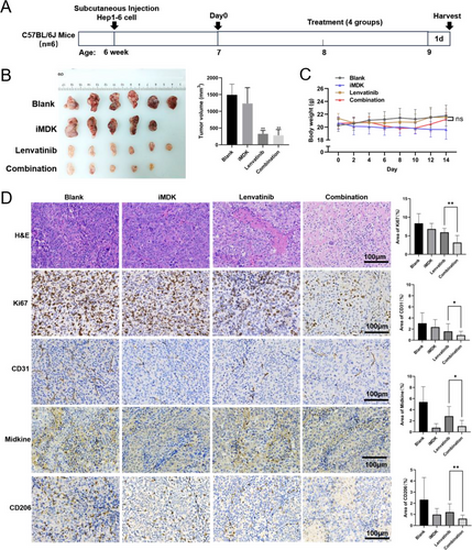
The combination of iMDK and Lenvatinib inhibits the growth of subcutaneous tumors in a mouse model of HCC. (A) Overview diagram of animal experiments. (B) Physical representation of subcutaneous tumors in mice during sample collection. Tumor volumes were calculated using the formula (length × width2)/2. Compare the significance of the difference between each group and the blank group using Student's t-test. (C) Body weight changes in mice throughout the administration period, with day 0 marked as the day of administration. (D) Results of H&E staining and IHC with HCC. Quantification of positive areas with ImageJ 2 software. Probability values p < .05 denote statistical differences, with statistical significance marked by “*” for p < .05 and “**” for p < .01. Six individuals were included in each experimental group (n = 6). All these experiments were conducted three times in a double-blind manner, and the quantification results are presented as the mean ± SD. |
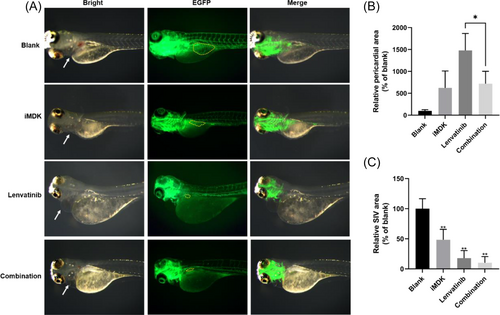
The detection of pericardial edema inhibition in zebrafish through fluorescence microscopy, assessing the combined effect of iMDK and Lenvatinib. (A) Zebrafish fertilized for 3 days were assigned to treatments corresponding to the control group and the administration group (iMDK, Lenvatinib, and a combination of both), with all compounds administered at a concentration of 1 μM. Images were captured using a fluorescence microscope, where green fluorescence identified the zebrafish blood vessels. White arrows indicate the site of pericardial edema, while the yellow dashed lines represent the SIVs. (B) Quantification of pericardial oedema area with ImageJ 2 software in zebrafish after treatment with iMDK, Lenvatinib, and a combination of iMDK and Lenvatinib. The area of pericardial oedema was defined as 100% for zebrafish in the blank group. (C) Quantification of SIV area with ImageJ 2 software in zebrafish after treatment with iMDK, Lenvatinib, and a combination of both iMDK and Lenvatinib. The SIV area was defined as 100% for zebrafish in the blank group. Compare the significance of the difference between each group and the blank group using Student's t-test. Probability values p < .05 indicate statistical differences, with statistical significance indicated by “*” for p < .05 and “**” for p < .01. Six individuals were included in each experimental group (n = 6). All these experiments were conducted three times in a double-blind manner, and the quantification results are presented as the mean ± SD. |