
Fig. 1
- ID
- ZDB-FIG-250528-1
- Publication
- Chen et al., 2025 - The combination of midkine inhibitor with Lenvatinib amplifies the suppression of hepatocellular carcinoma
- Other Figures
- All Figure Page
- Back to All Figure Page
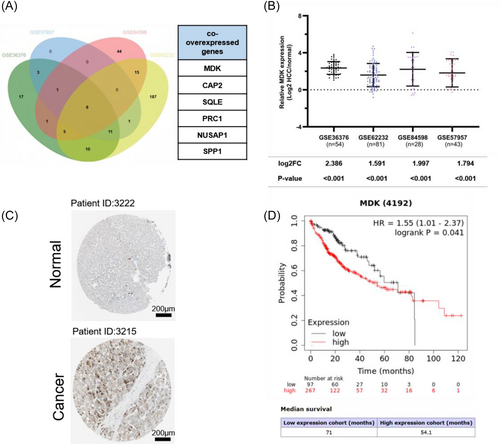
MDK exhibits high expression levels in HCC and correlates with unfavorable prognosis. (A) A Venn diagram is employed to analyze four liver cancer-related GEO databases (GSE36376, GSE57957, GSE62232, GSE84598) to identify upregulated genes with mRNA levels at least 1.5-fold higher than those in adjacent normal tissue. Six commonly upregulated differential genes were identified: MDK, CAP2, SQLE, PRC1, NUSAP1, and SPP1. (B) Relative expression levels of MDK genes across four GEO databases. (C) The IHC staining results of MDK protein in HCC tissues and normal tissues are sourced from the HPA database (https://www.proteinatlas.org/ENSG00000110492-MDK/pathology/liver+cancer#img). (D) The Kaplan–Meier plotter database provides statistical analysis of the correlation between MDK expression levels and prognosis in HCC tissues. |