
Fig. 3
- ID
- ZDB-FIG-250522-9
- Publication
- Qin et al., 2025 - Age-dependent glial heterogeneity and traumatic injury responses in a vertebrate brain structure
- Other Figures
- All Figure Page
- Back to All Figure Page
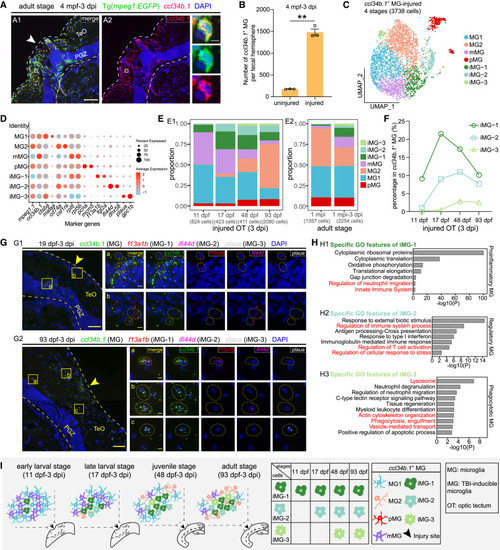
TBI responses of ccl34b.1+ microglia across stages (A and B) ccl34b.1 in situ hybridization (red) combined with EGFP immunostaining (green) on the midbrain sections of injured Tg(mpeg1:EGFP) at the adult stage (A) and the quantification of ccl34b.1+ microglia at the injury sites and the contralateral uninjured sides (n = 3 animals; mean ± SEM; parametric paired t tests; ∗∗p < 0.01) (B). Dashed lines indicate OT boundaries. White arrowhead indicates the injury site. Boxed areas are shown magnified in the right panel. Scale bars, 50 μm (A1 and A2) and 5 μm (zoom-in images). Nuclei are visualized by DAPI (blue). (C) UMAP plot showing re-clustering of ccl34b.1+ microglia from injured OT at 3 dpi across four stages. Cells are colored by their identities. iMG, TBI-inducible microglia. (D) Dot plot showing the expression of marker genes of each microglial subtype shown in (C). (E) Histograms showing the proportion of each ccl34b.1+ microglial subtype at each stage in injured OT at 3 dpi (E1) and in adult OT at 1 mpi and at 3 dpi after the second injury (E2). (F) Line graph showing the change of the proportions of each TBI-inducible microglial subtype across stages. The dot, square, and triangle represent iMG-1, iMG-2, and iMG-3, respectively. (G) asmFISH of ccl34b.1 (green), f13a1b (red), ifi44d (magenta), and plaua (white) on the midbrain sections of zebrafish at the late-larval (19 dpf-3 dpi) (G1) and adult (93 dpf-3 dpi) (G2) stages, respectively. Dashed lines indicate OT boundaries. Arrowheads indicate the injury sites. Boxed areas in merged images are shown magnified in the right panels. Dashed circles indicate individual ccl34b.1+f13a1b+ iMG-1 (a), ccl34b.1+ifi44d+ iMG-2 (b), and ccl34b.1+plaua+ iMG-3 (c) in the zoom-in images. Scale bars, 50 μm (merged images) and 5 μm (zoom-in images). Nuclei are visualized by DAPI (blue). (H) Bar graphs showing the enriched GO terms of TBI-inducible microglial subtype DEGs at the adult stage. (I) Schematic illustration showing the cellular composition (left four panels) and the response matrix of ccl34b.1+ microglial subtypes in the injured OT across stages. |