
Fig. 2
- ID
- ZDB-FIG-250522-8
- Publication
- Qin et al., 2025 - Age-dependent glial heterogeneity and traumatic injury responses in a vertebrate brain structure
- Other Figures
- All Figure Page
- Back to All Figure Page
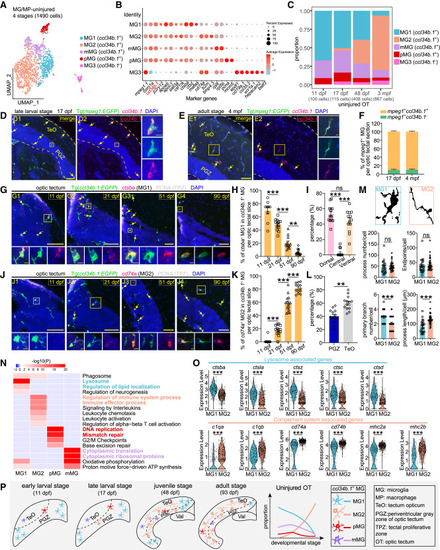
Temporal microglial heterogeneity under the physiological condition (A) UMAP plot showing re-clustering of microglia/macrophages from the uninjured OT across stages. Cells are colored by their identities. (B) Dot plot showing the expression of marker genes of each subtype in (A). (C) Histograms showing the proportion of each subtype in (A) at each stage. (D and E) ccl34b.1 in situ hybridization (red) combined with EGFP immunostaining (green) on the midbrain sections of Tg(mpeg1:EGFP) at the late-larval (17 dpf) (D) and adult (4 mpf) (E) stages. Dashed lines indicate OT boundaries, arrows indicate ccl34b.1+EGFP+ microglia. Boxed areas are shown magnified in the right panels. Scale bars, 50 μm (D1 and D2, E1 and E2) and 5 μm (zoom-in images). Nuclei are visualized by DAPI (blue). (F) Relative ratio of ccl34b.1+ and ccl34b.1− microglia in (D) and (E) (17 dpf, n = 8 sections/3 animals; 4 mpf, n = 13 sections/3 animals). (G and J) In situ hybridization of ctsba (G) and cd74a (J) combined with immunostaining of EGFP (green) and PCNA (white) on the midbrain sections of Tg(ccl34b.1:EGFP) at four stages, respectively. Signals of the probes are shown in red; arrows indicate the ctsba+EGFP+ MG1 (G) and cd74a+EGFP+ MG2 (J). Boxed areas are shown magnified in the bottom panels. Scale bars, 50 μm (G1–G4, J1–J4) and 5 μm (zoom-in images). Nuclei are visualized by DAPI (blue). (H) Percentage of ctsba+EGFP+ MG1 in ccl34b.1+ microglia per OT section at four stages in (G) (11 dpf, n = 9 sections/4 animals; 21 dpf, n = 13 sections/4 animals; 51 dpf, n = 12 sections/3 animals; 90 dpf, n = 15 sections/3 animals). (I) Relative ratio of ctsba+EGFP+ MG1 located in dorsal, central, or ventral region of OT at 21 dpf in (G2) (n = 13 sections/4 animals). (K) Percentage of cd74a+EGFP+ MG2 in ccl34b.1+ microglia per OT section at four stages in (J) (11 dpf, n = 18 sections/6 animals; 21 dpf, n = 13 sections/4 animals; 51 dpf, n = 14 sections/3 animals; 90 dpf, n = 13 sections/3 animals). (L) Relative ratio of cd74a+EGFP+ MG2 located in TeO or PGZ of OT at 90 dpf in (J4) (n = 13 sections/3 animals; mean ± SEM; parametric paired t tests; ∗∗p < 0.01). (M) Representative binary images and quantification showing differences in morphology between MG1 and MG2 (n = 23 MG1/4 animals, n = 35 MG2/3 animals; mean ± SEM; unpaired Student’s t tests; ns, p > 0.05; ∗∗∗p < 0.001). (N) GO enrichment heatmap of differentially expressed genes (DEGs) across ccl34b.1+ microglial subtypes, color coded by subtype-specific representative GO terms. (O) Violin plots showing the expression levels of lysosome-associated genes and complement system-associated genes in MG1 and MG2 (each dot represents a cell; mean ± SEM; unpaired Student’s t tests; ∗∗∗p < 0.001). (P) Schematic summary showing the temporal heterogeneity of tectal ccl34b.1+ microglial subtypes across stages. In (H), (I), and (K), data are mean ± SEM; statistical significance was determined by one-way ANOVA followed by Tukey’s HSD test (ns, p > 0.05; ∗∗p < 0.01; ∗∗∗p < 0.001). |