
- Title
-
Age-dependent glial heterogeneity and traumatic injury responses in a vertebrate brain structure
- Authors
- Qin, H., Yu, S., Han, R., He, J.
- Source
- Full text @ Cell Rep.

Glial heterogeneity under physiological and TBI conditions across stages (A) Schematic illustration of the experimental procedure for the glial scRNA-seq in this study. (B and D) Uniform manifold approximation and projection (UMAP) visualization of integrated scRNA-seq data of all qualified cells from uninjured (B) and injured (D) OTs across stages. Cells are colored by their identities. The proportion of each glial type is shown. (C and E) Dot plots showing the expression of canonical markers in each cell types in (B) and (D), respectively. |
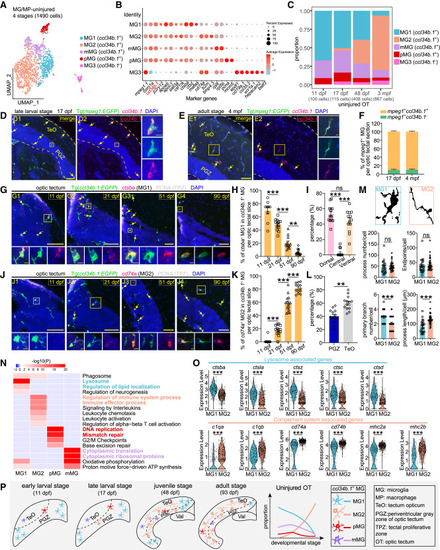
Temporal microglial heterogeneity under the physiological condition (A) UMAP plot showing re-clustering of microglia/macrophages from the uninjured OT across stages. Cells are colored by their identities. (B) Dot plot showing the expression of marker genes of each subtype in (A). (C) Histograms showing the proportion of each subtype in (A) at each stage. (D and E) ccl34b.1 in situ hybridization (red) combined with EGFP immunostaining (green) on the midbrain sections of Tg(mpeg1:EGFP) at the late-larval (17 dpf) (D) and adult (4 mpf) (E) stages. Dashed lines indicate OT boundaries, arrows indicate ccl34b.1+EGFP+ microglia. Boxed areas are shown magnified in the right panels. Scale bars, 50 μm (D1 and D2, E1 and E2) and 5 μm (zoom-in images). Nuclei are visualized by DAPI (blue). (F) Relative ratio of ccl34b.1+ and ccl34b.1− microglia in (D) and (E) (17 dpf, n = 8 sections/3 animals; 4 mpf, n = 13 sections/3 animals). (G and J) In situ hybridization of ctsba (G) and cd74a (J) combined with immunostaining of EGFP (green) and PCNA (white) on the midbrain sections of Tg(ccl34b.1:EGFP) at four stages, respectively. Signals of the probes are shown in red; arrows indicate the ctsba+EGFP+ MG1 (G) and cd74a+EGFP+ MG2 (J). Boxed areas are shown magnified in the bottom panels. Scale bars, 50 μm (G1–G4, J1–J4) and 5 μm (zoom-in images). Nuclei are visualized by DAPI (blue). (H) Percentage of ctsba+EGFP+ MG1 in ccl34b.1+ microglia per OT section at four stages in (G) (11 dpf, n = 9 sections/4 animals; 21 dpf, n = 13 sections/4 animals; 51 dpf, n = 12 sections/3 animals; 90 dpf, n = 15 sections/3 animals). (I) Relative ratio of ctsba+EGFP+ MG1 located in dorsal, central, or ventral region of OT at 21 dpf in (G2) (n = 13 sections/4 animals). (K) Percentage of cd74a+EGFP+ MG2 in ccl34b.1+ microglia per OT section at four stages in (J) (11 dpf, n = 18 sections/6 animals; 21 dpf, n = 13 sections/4 animals; 51 dpf, n = 14 sections/3 animals; 90 dpf, n = 13 sections/3 animals). (L) Relative ratio of cd74a+EGFP+ MG2 located in TeO or PGZ of OT at 90 dpf in (J4) (n = 13 sections/3 animals; mean ± SEM; parametric paired t tests; ∗∗p < 0.01). (M) Representative binary images and quantification showing differences in morphology between MG1 and MG2 (n = 23 MG1/4 animals, n = 35 MG2/3 animals; mean ± SEM; unpaired Student’s t tests; ns, p > 0.05; ∗∗∗p < 0.001). (N) GO enrichment heatmap of differentially expressed genes (DEGs) across ccl34b.1+ microglial subtypes, color coded by subtype-specific representative GO terms. (O) Violin plots showing the expression levels of lysosome-associated genes and complement system-associated genes in MG1 and MG2 (each dot represents a cell; mean ± SEM; unpaired Student’s t tests; ∗∗∗p < 0.001). (P) Schematic summary showing the temporal heterogeneity of tectal ccl34b.1+ microglial subtypes across stages. In (H), (I), and (K), data are mean ± SEM; statistical significance was determined by one-way ANOVA followed by Tukey’s HSD test (ns, p > 0.05; ∗∗p < 0.01; ∗∗∗p < 0.001). |
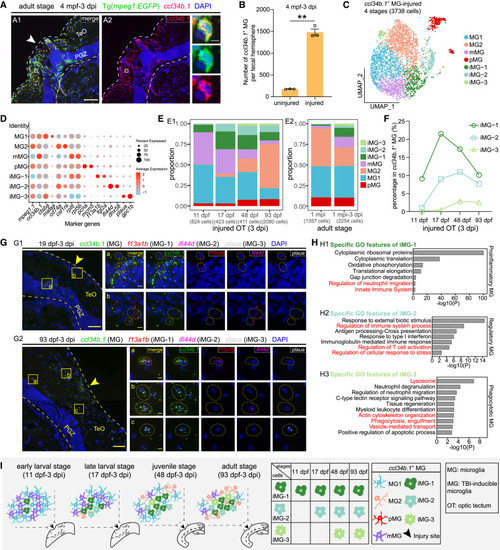
TBI responses of ccl34b.1+ microglia across stages (A and B) ccl34b.1 in situ hybridization (red) combined with EGFP immunostaining (green) on the midbrain sections of injured Tg(mpeg1:EGFP) at the adult stage (A) and the quantification of ccl34b.1+ microglia at the injury sites and the contralateral uninjured sides (n = 3 animals; mean ± SEM; parametric paired t tests; ∗∗p < 0.01) (B). Dashed lines indicate OT boundaries. White arrowhead indicates the injury site. Boxed areas are shown magnified in the right panel. Scale bars, 50 μm (A1 and A2) and 5 μm (zoom-in images). Nuclei are visualized by DAPI (blue). (C) UMAP plot showing re-clustering of ccl34b.1+ microglia from injured OT at 3 dpi across four stages. Cells are colored by their identities. iMG, TBI-inducible microglia. (D) Dot plot showing the expression of marker genes of each microglial subtype shown in (C). (E) Histograms showing the proportion of each ccl34b.1+ microglial subtype at each stage in injured OT at 3 dpi (E1) and in adult OT at 1 mpi and at 3 dpi after the second injury (E2). (F) Line graph showing the change of the proportions of each TBI-inducible microglial subtype across stages. The dot, square, and triangle represent iMG-1, iMG-2, and iMG-3, respectively. (G) asmFISH of ccl34b.1 (green), f13a1b (red), ifi44d (magenta), and plaua (white) on the midbrain sections of zebrafish at the late-larval (19 dpf-3 dpi) (G1) and adult (93 dpf-3 dpi) (G2) stages, respectively. Dashed lines indicate OT boundaries. Arrowheads indicate the injury sites. Boxed areas in merged images are shown magnified in the right panels. Dashed circles indicate individual ccl34b.1+f13a1b+ iMG-1 (a), ccl34b.1+ifi44d+ iMG-2 (b), and ccl34b.1+plaua+ iMG-3 (c) in the zoom-in images. Scale bars, 50 μm (merged images) and 5 μm (zoom-in images). Nuclei are visualized by DAPI (blue). (H) Bar graphs showing the enriched GO terms of TBI-inducible microglial subtype DEGs at the adult stage. (I) Schematic illustration showing the cellular composition (left four panels) and the response matrix of ccl34b.1+ microglial subtypes in the injured OT across stages. |
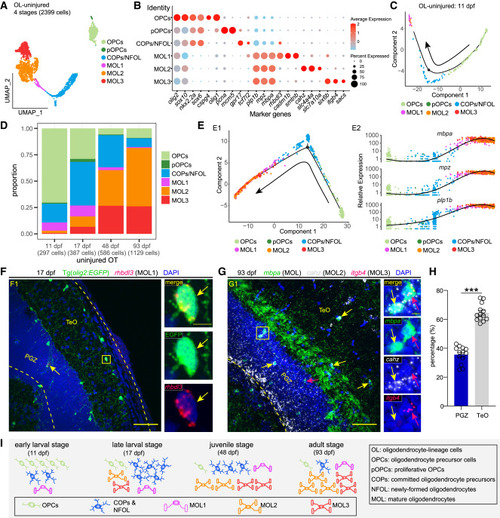
Temporal heterogeneity of oligodendrocyte-lineage cells under the physiological condition (A) UMAP plot showing re-clustering of oligodendrocyte-lineage cells (OL) from the uninjured OT across stages. Cells are colored by their identities. (B) Dot plot showing the expression of marker genes of each annotated cell type/subtype in (A). (C) Pseudo-time trajectory of OL in 11-dpf uninjured OT. (D) Histograms showing the proportion of each OL type/subtype at each stage. (E) Pseudo-time trajectories of OL from the uninjured OT across stages (E1) and the expression of myelin proteins along the trajectories (E2). (F) rhbdl3 in situ hybridization (red) combined with EGFP immunostaining (green) on the midbrain section of Tg(olig2:EGFP) at the late-larval stage (17 dpf). Yellow arrows indicate the rhbdl3+EGFP+ MOL1. (G) RNAscope of mbpa (green), cahz (white), and itgb4 (red) on the midbrain section of zebrafish at the adult stage (93 dpf). Yellow arrows indicate the cahz+mbpa+ MOL2, while red arrows indicate the itgb4+mbpa+ MOL3. (H) Relative ratio of cahz+mbpa+ MOL2 located in the TeO or PGZ of OT at 93 dpf in (G). (n = 13 sections/4 animals; mean ± SEM; parametric paired t tests; ∗∗∗p < 0.001). (I) Schematic illustration of oligodendrocyte-lineage cellular composition in uninjured OT across stages. In (F) and (G), dashed lines indicate OT boundaries. Boxed areas are shown magnified in the right panels. Scale bars, 50 μm (F1 and G1) and 5 μm (zoom-in images). Nuclei are visualized by DAPI (blue). |
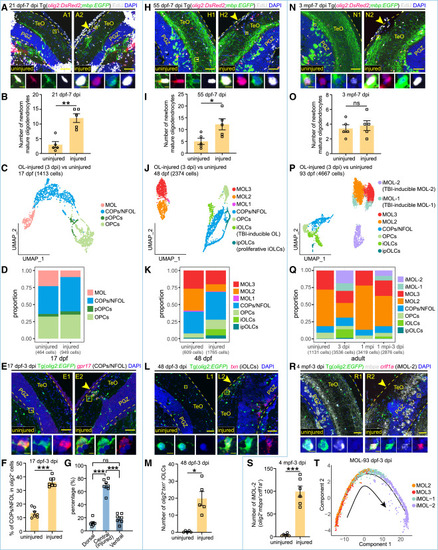
TBI responses of oligodendrocyte-lineage cells across stages (A and B, H and I, and N and O) Representative images (A, H, and N) and cell-number quantification (B, I, and O) of EdU+EGFP+DsRed2+ newborn MOL (EdU+, white; EGFP+, green; DsRed2+, red) in the uninjured and injured sides of Tg(olig2:DsRed2;mbp:EGFP) OT at the late-larval (21 dpf-7 dpi), juvenile (55 dpf-7 dpi), and adult (3 mpf-7 dpi) stages, respectively (n = 5 animals at each stage; mean ± SEM; parametric paired t tests; ns, p > 0.05; ∗p < 0.05; ∗∗p < 0.01). (C, J, and P) UMAP plots showing re-clustering of OL from the injured and uninjured OT at the late-larval (17 dpf) (C), juvenile (48 dpf) (J), and adult (93 dpf) (P) stages. Cells are colored by their identities. (D and K) Histograms showing the proportions of each cell types/subtypes under the injured or uninjured conditions in (C) and (J), respectively. (Q) Histograms showing the proportion of distinct cell type/subtype in adult OT under the uninjured, 3 dpi, 1 mpi, and 3 dpi of the second injury conditions, respectively. (E and F) Representative images (E) and proportion quantification (F) of gpr17+EGFP+ COPs/NFOL (gpr17+, red; EGFP+, green) in EGFP+ OL in the uninjured and injured sides of Tg(olig2:EGFP) OT at the late-larval stage (17 dpf–3 dpi; n = 7 animals; mean ± SEM; parametric paired t tests; ∗∗∗p < 0.001). (G) Bar plot showing the percentage of gpr17+EGFP+ COPs/NFOL located at dorsal, central, or ventral OT in the injured side shown in (E) (n = 7 animals; mean ± SEM; one-way ANOVA, followed by Tukey’s HSD test; ∗∗∗p < 0.001; ns, p > 0.05). (L and M) Representative images (L) and cell-number quantification (M) of txn+EGFP+ iOLCs (txn+, red; EGFP+, green) in the uninjured and injured sides of Tg(olig2:EGFP) OT at the juvenile stage (48 dpf–3 dpi; n = 5 animals; mean ± SEM; parametric paired t tests; ∗p < 0.05). (R and S) Representative images (R) and cell-number quantification (S) of crlf1a+mbpa+EGFP+ iMOL-2 (crlf1a+, red; mbpa+, white; EGFP+, green) in the uninjured and injured sides of Tg(olig2:EGFP) OT at the adult stage (4 mpf–3 dpi; n = 6 animals; mean ± SEM; parametric paired t tests; ∗∗∗p < 0.001). (T) Pseudo-time trajectory of mature oligodendrocyte subtypes from 93 dpf–3 dpi OT. In (A), (H), (N), (E), (L), and (R), dashed lines indicate OT boundaries. Boxed areas are shown magnified in the bottom panels. Arrowheads indicate the injury sites. Scale bars, 50 μm (A1 and A2, H1 and H2, N1 and N2, E1 and E2, L1 and L2, R1 and R2) and 5 μm (zoom-in images). Nuclei are visualized by DAPI (blue). |

Spatially distinct tectal radial astrocyte subtypes and TBI responses of central-located qRA subtypes across stages (A) UMAP plot showing re-clustering of quiescent radial astrocytes from uninjured OT across four stages. Cells are colored by their identities. qRA, quiescent radial astrocytes. (B) Dot plot showing the expression of marker genes of each qRA subtype in (A). (C) Histograms showing the proportion of each qRA subtype at each stage. (D–J) In situ hybridization of qRA subtype-specific marker genes (zgc:153704, luzp2, ntn1a, rdh10a, tenm3) (red) combined with BLBP immunostaining (green) on the uninjured OT sections of 20-dpf (D–F) and adult (G–J) zebrafish. Left/right panels of each figure represent different regions of the OT as labeled on the images. Boxed areas are shown magnified in the bottom panels. (K, M, O, and Q) Representative images of proliferative radial astrocytes (pRA, PCNA+BLBP+) located at central OT in the uninjured (upper panel) and injured (lower panel) sides of zebrafish at the early-larval (11 dpf–3 dpi) (K), late-larval (17 dpf–3 dpi) (M), juvenile (48 dpf–3 dpi) (O), and adult (4 mpf–3 dpi) (Q) stages. Arrowheads indicate the injury sites. Boxed areas in (M), (O), and (Q) are shown magnified in the right panels; white asterisks in the zoom-in images indicate PCNA+BLBP+ pRA. (L, N, P, and R) Quantification of pRA located at central OT in the uninjured and injured sides of zebrafish at 11 dpf–3 dpi (L, n = 15 animals), 17 dpf–3 dpi (N, n = 8 animals), 48 dpf–3 dpi (P, n = 5 animals), and 4 mpf–3 dpi (R, n = 5 animals) (mean ± SEM; parametric paired t tests; ns, p > 0.05; ∗∗p < 0.01; ∗∗∗p < 0.001). In (D–J), (K), (M), (O), and (Q), dashed lines indicate OT boundaries. Scale bars, 50 μm (D1–J3, K1–K6, M1–M6, O1–O6, Q1–Q6) and 5 μm (zoom-in images). Nuclei are visualized by DAPI (blue). |

Glia interactome revealed the molecular logic underlying TBI-induced glial responses (A–E) Dot plots showing the ligand-receptor pairs with distinct patterns responsible for partial glial interactions with high communication probability (>1) among the eight conditions shown in Figure S8B. Interacting cell types are annotated above the plot. Age and states of the samples are displayed along x axis (11, 11 dpf; 17, 17 dpf; 48, 48 dpf; 93, 93 dpf), which are grouped as physiological (in blue box) and TBI (3 dpi; in pink box) conditions. y axis lists ligand-receptor pairs and distinct patterns of the interactions, with text-discussed pairs highlighted in red. Commun. Prob., communication probability. (F and G) Representative images (F) and quantification (G) of proliferative radial astrocytes (PCNA+BLBP+) located at central OT in uninjured (left two panels) and injured (right two panels) sides of 11-dpf notch3+/− (upper panel; n = 13 animals) (G1) or dla+/− (lower panel; n = 7 animals) (G2) zebrafish (mean ± SEM; parametric paired t tests; ∗∗p < 0.01, ∗∗∗p < 0.001). (H and I) Representative images (H) and quantification (I) of ccl34b.1+ microglia (green) located at central OT in uninjured and injured sides of the blank-ctrl (left two panels) or cxcr4b-KO (right two panels) Tg(ccl34b.1:EGFP) zebrafish, which were injured at the early-larval stage (upper panel, 10 dpf–2 dpi; blank-ctrl, n = 14 animals; cxcr4b-KO, n = 10 animals) (I1) or late-larval stage (lower panel, 18 dpf–2 dpi; blank-ctrl, n = 11 animals; cxcr4b-KO, n = 10 animals) (I2) (mean ± SEM; one-way ANOVA, followed by Tukey’s HSD test; ns, p > 0.05, ∗∗∗p < 0.001). In (F) and (H), dashed lines indicate OT boundaries, arrowheads indicate the injury sites. Scale bars, 50 μm. Nuclei are visualized by DAPI (blue). |