
Fig. 5
- ID
- ZDB-FIG-250507-88
- Publication
- Jerabkova-Roda et al., 2025 - Peripheral positioning of lysosomes supports melanoma aggressiveness
- Other Figures
- All Figure Page
- Back to All Figure Page
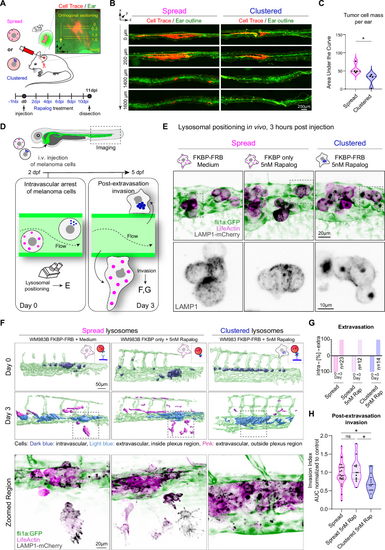
A–C Lysosome clustering prevents tumor cell invasion in mice. Cells with spread (FKBP only, 5 nM Rap) and clustered (FKBP-FRB, 5 nM Rap) lysosomes were injected intradermally in mouse ear. B Representative Immunofluorescence examples of mouse ear sections. Red = tumor cells, green = ear (autofluorescence). C Quantification of cell mass in the ears when lysosomes are spread and clustered (n = 3 mice, 4 tumors per group), calculated from cell area per each section and distance in tumor: (Mean ± SD) = 55.06 ± 14.47, 27.55 ± 17.34, respectively, p value 0.0286, Mann–Whitney test, two-tailed. D–H Perinuclear lysosome clustering prevents cell invasion in zebrafish. D Illustration of the invasion assay in zebrafish. Fli1a:GFP (green endothelium) zebrafish embryos (48 hpf) were injected intra-vascularly with WM983B cells and imaged at day 0 and day 3 post injection to assess the post-extravasation invasion potential of cancer cells with different lysosomal positioning. E Representative confocal images of WM983B cells (stably expressing LAMP1-mCherry= black, and LifeActin-miRFP670= magenta) with spread (FKBP-FRB control; FKBP only 5 nM Rapalog) and clustered (FKBP-FRB, 5 nM Rapalog) lysosomes at 3 h post-injection shown as maximum z projection, in triplicate. F Top: IMARIS segmentation, representative examples at day 0 (3 h after cell injection) and at day 3 (72 h post injection). Bottom: Zoomed regions showing confocal images corresponding to the IMARIS segmentation at day 3. Images are shown as a maximum z projection (LAMP1-mCherry= black, LifeActin-miRFP670= magenta, vasculature= green). G Quantification of cell extravasation at day 0 and day 3. Negative axis= intravascular cells, positive axis= extravascular cells. H Post-extravasation invasion (PEI) potential (day 3) was calculated as a ratio: area of cells that migrated outside of the vasculature region to the total area of cells. FKBP-FRB (spread) n = 23 embryos, FKBP only (spread) n = 12 embryos, FKBP-FRB (clustered) n = 15 embryos, PEI (Mean ± SD) = 0.9616 ± 0.3284, 1.060 ± 0.3316, 0.7085 ± 0.2568, respectively, in triplicate, p values (from top, left) = 0.0317, >0.9999, 0.0172, Kruskal-Wallis with Dunn’s test. One dot= 1 fish, normalized to spread condition. * p < 0.05; ** p < 0.01; *** p < 0.001; **** p < 0.0001. Source data are provided as a Source Data file. |