
Fig. 2
- ID
- ZDB-FIG-250507-85
- Publication
- Jerabkova-Roda et al., 2025 - Peripheral positioning of lysosomes supports melanoma aggressiveness
- Other Figures
- All Figure Page
- Back to All Figure Page
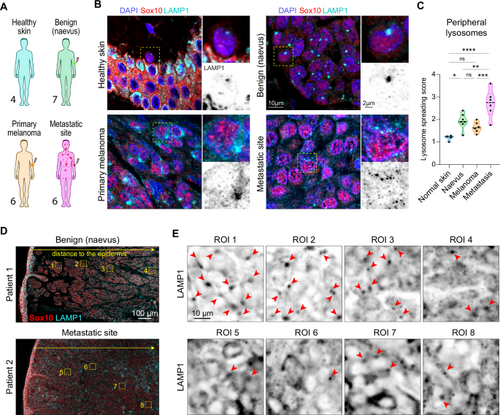
A Samples of patient biopsies were obtained from healthy skin donors (n = 4) and from patients with benign tissue (nevus, n = 7), primary melanoma (n = 6) and metastatic melanoma (skin metastasis, n = 6). Silhouettes (Servier medical art CC:BY 4.0 license) are color-coded according to melanoma stage. B Representative images of patient biopsies sections: samples were labeled for SOX10 (red), LAMP1 (cyan) and nuclei (blue) by immunofluorescence, full tissue section was imaged by slide scanner. C Quantification of lysosome spreading. Ten random regions were analyzed in a blinded setup for lysosome positioning. Lysosome spreading score, range 1–4: (Mean ± SD) = 1.184 ± 0.1276, 1.929 ± 0.3450, 1.656 ± 0.2373, 2.793 ± 0.6094, respectively. One dot represents 1 patient, p values (from top, left) = <0.0001, 0.1544, 0.0087, 0.0218, 0.2298, 0.0010, ordinary one-way ANOVA with Holm-Sidak’s test, * p < 0.05; ** p < 0.01; *** p < 0.001; **** p < 0.0001. D, E Lysosome spreading shows a spatial heterogeneity within the tumor mass. D Representative images of biopsies from patient 1 (benign tissue, nevus) and patient 2 (metastatic melanoma). Low magnification image mapping the tissue section, stained for LAMP1 (cyan), SOX10 (red) by immunohistochemistry, 2 patients per group. E Zoomed regions from panel (D), showing the progressive change in lysosome spreading with increasing distance to the epidermis, single channel: LAMP1 antibody staining. Red arrows point to clustered lysosomes. Source data are provided as a Source Data file. |