
Fig. 4
- ID
- ZDB-FIG-250507-87
- Publication
- Jerabkova-Roda et al., 2025 - Peripheral positioning of lysosomes supports melanoma aggressiveness
- Other Figures
- All Figure Page
- Back to All Figure Page
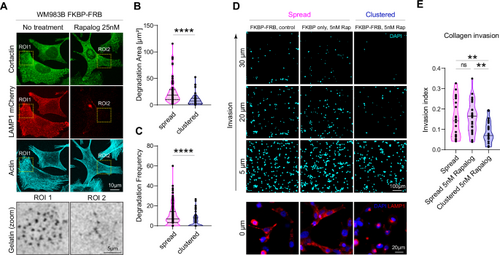
A–C Peripherally positioned lysosomes promote gelatin degradation. A Representative images of WM983B cells (LAMP1-mCherry-FKBP-FRB) with spread lysosomes (medium) and clustered lysosomes (25 nM Rapalog), cultured on FITC-gelatin (gray), stained for cortactin (green), LAMP1 (red) and actin (cyan), in triplicate. B Degradation Area (Mean ± SD) = 24.75 ± 23.29 n = 73 cells, 9.41 ± 9.94 n = 50 cells, respectively, p value: <0.0001, Mann–Whitney test, two-tailed. One dot represents 1 cell. C Degradation frequency (Mean ± SD) = 10.14 ± 10.45 n = 138 cells, 4.43 ± 6.04 n = 102 cells, respectively, p value: <0.0001, Mann–Whitney test, two-tailed. D, E Lysosome perinuclear clustering decreases collagen invasion, live cell imaging. D Bottom: Representative images of WM983B cells with spread lysosomes (FKBP-FRB control and FKBP only with Rapalog 5 nM) and clustered lysosomes (FKBP-FRB with 5 nM Rapalog), nucleus (blue), lysosomes (red). Top: Representative images of cell invasion after 24 h, nucleus (cyan). E Quantification of the invasion index: FKBP-FRB (spread) n = 20, FKBP only (spread) n = 25, FKBP-FRB (clustered) n = 25, (Mean ± SD) = 0.1526 ± 0.094, 0.1592 ± 0.079, 0.0836 ± 0.053, respectively, in triplicate, p value (from top, left) = 0.0067, 0.7728, 0.0023, ordinary one-way ANOVA, Holm-Sidak multiple comparison test. One dot represents 1 field of view. * p < 0.05; ** p < 0.01; *** p < 0.001; **** p < 0.0001. Source data are provided as a Source Data file. |