
Fig. 1
- ID
- ZDB-FIG-250507-84
- Publication
- Jerabkova-Roda et al., 2025 - Peripheral positioning of lysosomes supports melanoma aggressiveness
- Other Figures
- All Figure Page
- Back to All Figure Page
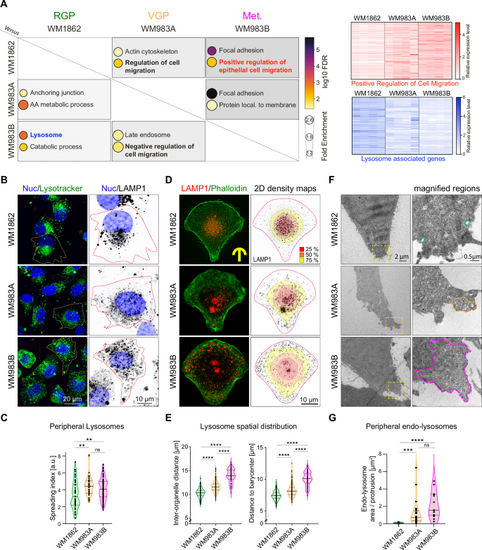
A Transcriptomics comparison of melanoma cells reveals increased expression of genes regulating cell migration and decreased expression of lysosome-associated genes in metastatic cells, quadruplicate. Differentially expressed genes (pAdj<0.01) were analyzed using gene ontology (GO). Left: Selected GO terms are listed, showing their fold enrichment and log10 FDR in paired comparisons, Right: Heatmaps for two main pathways identified, white = low expression, blue/red = high expression. B, C Lysosome positioning in non-constrained cells, live cell imaging. B Representative images: NucBlue (nucleus), green lysotracker (lysosomes). WM1862 n = 51, WM983A n = 40, WM983B n = 108 cells, in triplicate. C Spreading index, CellProfiler (Mean ± SD) = 3.390 ± 1.597, 4.477 ± 1.180, 4.111 ± 1.225, respectively. p values (from top) = 0.0069, 0.0011, 0.6009, one dot= 1 cell. D, E Lysosome positioning in melanoma cells on micropatterns. D Left: Immunofluorescence (max z-projection), Right: overlay of LAMP1 signal and 2D density maps showing LAMP1 distribution (R software), displaying the smallest area occupied by 25% (red), 50% (orange) and 75% (yellow) of all compartments. E Left: Inter-organelle distance (IOD)= average of distances between all lysosomes. IOD (Mean ± SD) = 10.30 ± 0.94, 11.56 ± 1.15, 13.99 ± 1.40, respectively. One dot= 1 cell, p < 0.0001 in all conditions. Right: Distance to barycenter (DB)= distance from each lysosome to the geometric center (lysosomes). DB (Mean ± SD) = 7.40 ± 0.69, 8.21 ± 0.93, 10.03 ± 1.07, respectively. One dot= 1 cell, p < 0.0001 in all conditions. WM1862, n = 182 cells, WM983A, n = 231 cells, WM983B, n = 82 cells, in triplicate. F, G Electron microscopy reveals that the presence of endolysosomal compartments in protrusions scales with melanoma aggressiveness. F Representative images, endolysosome-rich regions in protrusions are circled in dashed lines, color-coded per melanoma stage. G Area occupied by endo-lysosomes in protrusions: WM1862 n = 14, WM983A n = 24, WM983B n = 15, Area ± SD = 0.1075 ± 0.05614, 1.219 ± 1.474, 2.106 ± 1.457, respectively. One dot= 1 field of view, p values (from top): <0.0001, 0.1672, 0.0001. * p < 0.05; ** p < 0.01; *** p < 0.001; **** p < 0.0001. All statistics are done using Kruskal-Wallis with Dunn’s multiple comparison post-hoc test. Source data are provided as a Source Data file. |