
- Title
-
Peripheral positioning of lysosomes supports melanoma aggressiveness
- Authors
- Jerabkova-Roda, K., Peralta, M., Huang, K.J., Mousson, A., Bourgeat Maudru, C., Bochler, L., Busnelli, I., Karali, R., Justiniano, H., Lisii, L.M., Carl, P., Mittelheisser, V., Asokan, N., Larnicol, A., Lefebvre, O., Lachuer, H., Pichot, A., Stemmelen, T., Molitor, A., Scheid, L., Frenger, Q., Gros, F., Hirschler, A., Delalande, F., Sick, E., Carapito, R., Carapito, C., Lipsker, D., Schauer, K., Rondé, P., Hyenne, V., Goetz, J.G.
- Source
- Full text @ Nat. Commun.
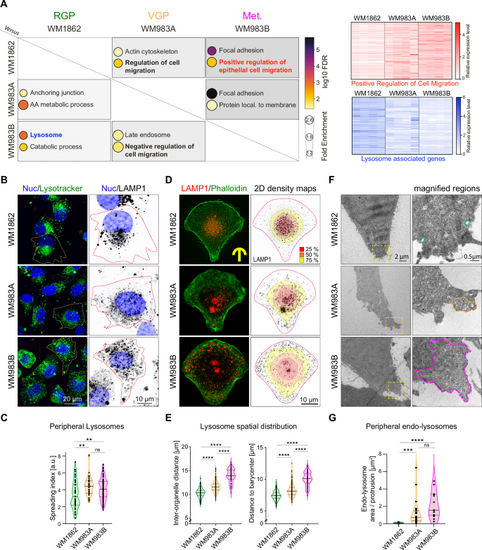
A Transcriptomics comparison of melanoma cells reveals increased expression of genes regulating cell migration and decreased expression of lysosome-associated genes in metastatic cells, quadruplicate. Differentially expressed genes (pAdj<0.01) were analyzed using gene ontology (GO). Left: Selected GO terms are listed, showing their fold enrichment and log10 FDR in paired comparisons, Right: Heatmaps for two main pathways identified, white = low expression, blue/red = high expression. B, C Lysosome positioning in non-constrained cells, live cell imaging. B Representative images: NucBlue (nucleus), green lysotracker (lysosomes). WM1862 n = 51, WM983A n = 40, WM983B n = 108 cells, in triplicate. C Spreading index, CellProfiler (Mean ± SD) = 3.390 ± 1.597, 4.477 ± 1.180, 4.111 ± 1.225, respectively. p values (from top) = 0.0069, 0.0011, 0.6009, one dot= 1 cell. D, E Lysosome positioning in melanoma cells on micropatterns. D Left: Immunofluorescence (max z-projection), Right: overlay of LAMP1 signal and 2D density maps showing LAMP1 distribution (R software), displaying the smallest area occupied by 25% (red), 50% (orange) and 75% (yellow) of all compartments. E Left: Inter-organelle distance (IOD)= average of distances between all lysosomes. IOD (Mean ± SD) = 10.30 ± 0.94, 11.56 ± 1.15, 13.99 ± 1.40, respectively. One dot= 1 cell, p < 0.0001 in all conditions. Right: Distance to barycenter (DB)= distance from each lysosome to the geometric center (lysosomes). DB (Mean ± SD) = 7.40 ± 0.69, 8.21 ± 0.93, 10.03 ± 1.07, respectively. One dot= 1 cell, p < 0.0001 in all conditions. WM1862, n = 182 cells, WM983A, n = 231 cells, WM983B, n = 82 cells, in triplicate. F, G Electron microscopy reveals that the presence of endolysosomal compartments in protrusions scales with melanoma aggressiveness. F Representative images, endolysosome-rich regions in protrusions are circled in dashed lines, color-coded per melanoma stage. G Area occupied by endo-lysosomes in protrusions: WM1862 n = 14, WM983A n = 24, WM983B n = 15, Area ± SD = 0.1075 ± 0.05614, 1.219 ± 1.474, 2.106 ± 1.457, respectively. One dot= 1 field of view, p values (from top): <0.0001, 0.1672, 0.0001. * p < 0.05; ** p < 0.01; *** p < 0.001; **** p < 0.0001. All statistics are done using Kruskal-Wallis with Dunn’s multiple comparison post-hoc test. Source data are provided as a Source Data file. |
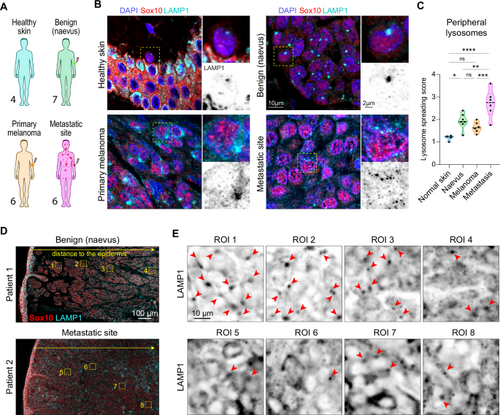
A Samples of patient biopsies were obtained from healthy skin donors (n = 4) and from patients with benign tissue (nevus, n = 7), primary melanoma (n = 6) and metastatic melanoma (skin metastasis, n = 6). Silhouettes (Servier medical art CC:BY 4.0 license) are color-coded according to melanoma stage. B Representative images of patient biopsies sections: samples were labeled for SOX10 (red), LAMP1 (cyan) and nuclei (blue) by immunofluorescence, full tissue section was imaged by slide scanner. C Quantification of lysosome spreading. Ten random regions were analyzed in a blinded setup for lysosome positioning. Lysosome spreading score, range 1–4: (Mean ± SD) = 1.184 ± 0.1276, 1.929 ± 0.3450, 1.656 ± 0.2373, 2.793 ± 0.6094, respectively. One dot represents 1 patient, p values (from top, left) = <0.0001, 0.1544, 0.0087, 0.0218, 0.2298, 0.0010, ordinary one-way ANOVA with Holm-Sidak’s test, * p < 0.05; ** p < 0.01; *** p < 0.001; **** p < 0.0001. D, E Lysosome spreading shows a spatial heterogeneity within the tumor mass. D Representative images of biopsies from patient 1 (benign tissue, nevus) and patient 2 (metastatic melanoma). Low magnification image mapping the tissue section, stained for LAMP1 (cyan), SOX10 (red) by immunohistochemistry, 2 patients per group. E Zoomed regions from panel (D), showing the progressive change in lysosome spreading with increasing distance to the epidermis, single channel: LAMP1 antibody staining. Red arrows point to clustered lysosomes. Source data are provided as a Source Data file. |

A, B Rapalog-mediated perinuclear clustering of lysosomes. A Lysosomes in WM983B cells stably expressing LAMP1-mCherry-FKBP and BicD2-FRB can be clustered using Rapalog compound (Rap) which induces FKBP-FRB rapid heterodimerization. B Representative images of lysosome perinuclear clustering 24 h after 5 nM Rapalog treatment. C Correlative light and electron microscopy of clustered perinuclear LAMP1 positive compartments. Representative immunofluorescent images and a high magnification overlay of fluorescent and electron microscopy images (LAMP1 in red/magenta, nucleus in blue) are shown for each condition, in duplicate. D Melanoma secretome is altered by lysosome perinuclear clustering. Differential quantitative mass spectrometry analysis of proteins secreted to the cell medium by WM983B (FKBP-FRB) cells in the absence or presence of 5 nM Rapalog. Proteins known to be lysosome-associated are labeled with their name. Magenta = proteins upregulated in cells with spread lysosomes, blue = proteins upregulated in cells with clustered lysosomes (p < 0.05). Differential analysis was done using Limma moderated t test with adaptive Benjamini-Hochberg procedure to adjust the p values. E–I Rapalog-induced perinuclear clustering inhibits lysosome exocytosis. E Lysosome secretion was assessed by TIRF microscopy using VAMP7-pHluorin probe, which is quenched in lysosome acidic environment and brightly fluorescent once exposed to the alkaline pH of the extracellular space. F Representative images of co-cultured WM983B-LAMP1-mCherry cells expressing either single heterodimerizing domain (FKBP only, magenta) or both the domains (FKBP-FRB, blue) treated with 25 nM Rapalog, TIRF microscopy. G TIRF movie was divided into three time-segments (black: 0–25 s, green: 25–50 s, dark red: 50–75 s) and displayed as maximum projection showing the number of events per each time-segment. Two representative examples: ROI 1= spread lysosomes, ROI 2= clustered lysosomes. H, I Quantification of the TIRF movie. H Number of lysosome secretion events in 1 min, one dot= 1 cell. I Event duration, one dot= 1 event, n = 5 cells. Events per cell (Mean ± SD): spread = 27.80 ± 7.19, clustered = 14.40 ± 8.23, p value = 0.0397. Event duration (Mean ± SD): spread = 2.46 ± 2.36, clustered = 2.56 ± 2.20 s, p value = 0.3518. Mann–Whitney test, two-tailed with Dunn’s multiple comparison post hoc test. Source data are provided as a Source Data file. |
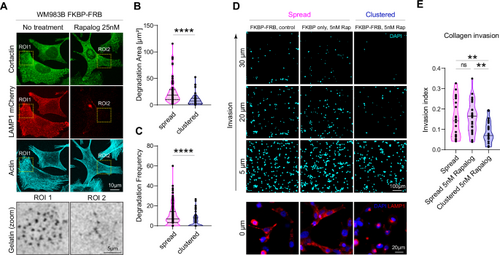
A–C Peripherally positioned lysosomes promote gelatin degradation. A Representative images of WM983B cells (LAMP1-mCherry-FKBP-FRB) with spread lysosomes (medium) and clustered lysosomes (25 nM Rapalog), cultured on FITC-gelatin (gray), stained for cortactin (green), LAMP1 (red) and actin (cyan), in triplicate. B Degradation Area (Mean ± SD) = 24.75 ± 23.29 n = 73 cells, 9.41 ± 9.94 n = 50 cells, respectively, p value: <0.0001, Mann–Whitney test, two-tailed. One dot represents 1 cell. C Degradation frequency (Mean ± SD) = 10.14 ± 10.45 n = 138 cells, 4.43 ± 6.04 n = 102 cells, respectively, p value: <0.0001, Mann–Whitney test, two-tailed. D, E Lysosome perinuclear clustering decreases collagen invasion, live cell imaging. D Bottom: Representative images of WM983B cells with spread lysosomes (FKBP-FRB control and FKBP only with Rapalog 5 nM) and clustered lysosomes (FKBP-FRB with 5 nM Rapalog), nucleus (blue), lysosomes (red). Top: Representative images of cell invasion after 24 h, nucleus (cyan). E Quantification of the invasion index: FKBP-FRB (spread) n = 20, FKBP only (spread) n = 25, FKBP-FRB (clustered) n = 25, (Mean ± SD) = 0.1526 ± 0.094, 0.1592 ± 0.079, 0.0836 ± 0.053, respectively, in triplicate, p value (from top, left) = 0.0067, 0.7728, 0.0023, ordinary one-way ANOVA, Holm-Sidak multiple comparison test. One dot represents 1 field of view. * p < 0.05; ** p < 0.01; *** p < 0.001; **** p < 0.0001. Source data are provided as a Source Data file. |
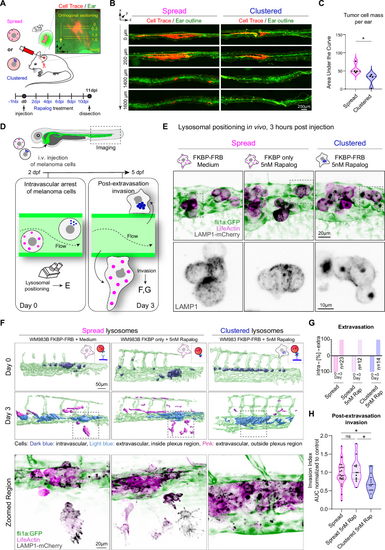
A–C Lysosome clustering prevents tumor cell invasion in mice. Cells with spread (FKBP only, 5 nM Rap) and clustered (FKBP-FRB, 5 nM Rap) lysosomes were injected intradermally in mouse ear. B Representative Immunofluorescence examples of mouse ear sections. Red = tumor cells, green = ear (autofluorescence). C Quantification of cell mass in the ears when lysosomes are spread and clustered (n = 3 mice, 4 tumors per group), calculated from cell area per each section and distance in tumor: (Mean ± SD) = 55.06 ± 14.47, 27.55 ± 17.34, respectively, p value 0.0286, Mann–Whitney test, two-tailed. D–H Perinuclear lysosome clustering prevents cell invasion in zebrafish. D Illustration of the invasion assay in zebrafish. Fli1a:GFP (green endothelium) zebrafish embryos (48 hpf) were injected intra-vascularly with WM983B cells and imaged at day 0 and day 3 post injection to assess the post-extravasation invasion potential of cancer cells with different lysosomal positioning. E Representative confocal images of WM983B cells (stably expressing LAMP1-mCherry= black, and LifeActin-miRFP670= magenta) with spread (FKBP-FRB control; FKBP only 5 nM Rapalog) and clustered (FKBP-FRB, 5 nM Rapalog) lysosomes at 3 h post-injection shown as maximum z projection, in triplicate. F Top: IMARIS segmentation, representative examples at day 0 (3 h after cell injection) and at day 3 (72 h post injection). Bottom: Zoomed regions showing confocal images corresponding to the IMARIS segmentation at day 3. Images are shown as a maximum z projection (LAMP1-mCherry= black, LifeActin-miRFP670= magenta, vasculature= green). G Quantification of cell extravasation at day 0 and day 3. Negative axis= intravascular cells, positive axis= extravascular cells. H Post-extravasation invasion (PEI) potential (day 3) was calculated as a ratio: area of cells that migrated outside of the vasculature region to the total area of cells. FKBP-FRB (spread) n = 23 embryos, FKBP only (spread) n = 12 embryos, FKBP-FRB (clustered) n = 15 embryos, PEI (Mean ± SD) = 0.9616 ± 0.3284, 1.060 ± 0.3316, 0.7085 ± 0.2568, respectively, in triplicate, p values (from top, left) = 0.0317, >0.9999, 0.0172, Kruskal-Wallis with Dunn’s test. One dot= 1 fish, normalized to spread condition. * p < 0.05; ** p < 0.01; *** p < 0.001; **** p < 0.0001. Source data are provided as a Source Data file. |