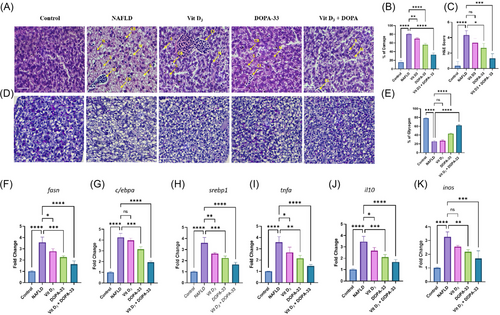
Histology analysis of liver section using H&E staining in HCD-induced zebrafish adult. The graph represents (A) the H&E-stained liver section. (B) The percentage of cell damage in the liver section. (C) H&E scores in the liver section. (D) PAS staining of liver section. (E) Percentage of glycogen accumulation. Gene expression of HCD-induced NAFLD-induced adult zebrafish, (F) fasn. (G) c/ebpa. (H) srebp1. (I) tnf-α. (J) il-10. (K) inos. Vit D3 at the concentration of 0.1 µM, DOPA-33 compound at 10 µM, Vit D3 (0.1 µM) + DOPA-33 (10 µM). All the assays were conducted in triplicates as three independent experiments. The results are presented as mean ± standard deviation (SD). The symbol * indicates a significant difference between the tested samples and the NAFLD group (*p < 0.0332, **p < 0.0021, ***p < 0.0002, ****p < 0.0001, and ns = not significant). H&E—hematoxylin and eosin; N—necrosis; S—steatosis; CI—cellular infiltration; CB—cellular ballooning; PAS—periodic acid–Schiff; fasn—fatty acid synthase; c/ebpa—CCAAT/enhancer binding protein alpha; srebp1—sterol regulatory element-binding protein 1; il-10—interleukin 10; tnfa—tumor necrosis factor alpha; inos—inducible nitric oxide synthase; NAFLD—non-alcoholic fatty liver disease; Vit D3—vitamin D3; DOPA-33—dioxopiperidinamide-33; Vit D3 + DOPA-33—vitamin D3 + dioxopiperidinamide-33. Scale bar = 20 µm.
|
