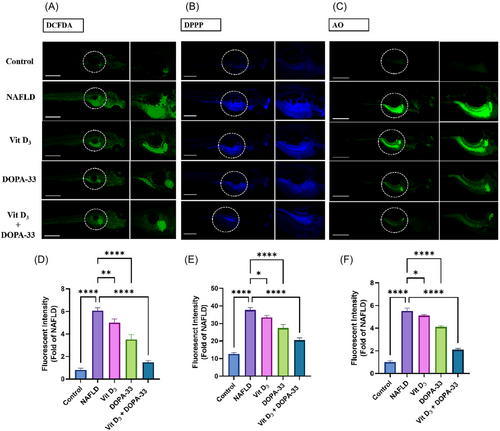
Measurement of intracellular ROS utilizing DCFH-DA, LPO assessment using DPPP, and apoptosis using AO staining in HCD-induced NAFLD in zebrafish larvae. The graph represents (A) DCFDA-stained larvae and fluorescent intensity. (B) DPPP-stained larvae. (C) AO-stained larvae. (D) Staining intensities fold change of DCFDA. (E). Staining intensities fold change of DPPP. (F) Staining intensities fold change of AO. NAFLD-HCD induced larvae, Vit D3 at the concentration of 0.1 µM, DOPA-33 compound at 10 µM, Vit D3 (0.1 µM) + DOPA-33 (10 µM). All the assays were conducted in triplicates as three independent experiments. The results are presented as mean ± standard deviation (SD). The symbol * indicates a significant difference between the tested samples and the NAFLD group (*p < 0.0332, **p < 0.0021, ****p < 0.0001). DCFDA—2′,7-dichlorodihydrofluorescein diacetate; DPPP—diphenyl-1-pyrenylphosphine; AO—acridine orange; NAFLD—non-alcoholic fatty liver disease; Vit D3—vitamin D3; DOPA-33—dioxopiperidinamide-33; Vit D3 + DOPA-33—vitamin D3 + dioxopiperidinamide-33. Scale bar = 100 µm.
|
