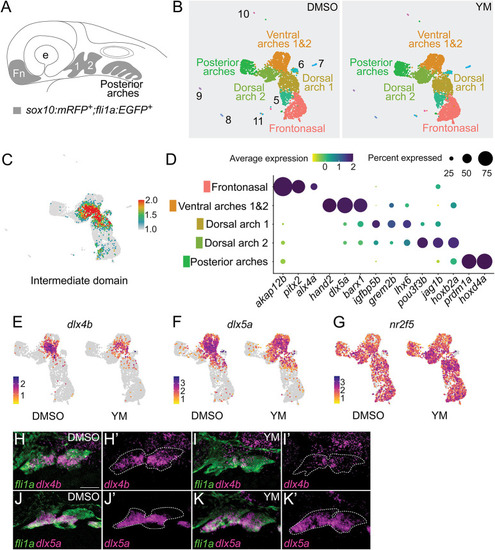
YM reduces expression of intermediate patterning genes and increases expression of dorsal patterning genes. (A) Schematic of a zebrafish embryo at 36 hpf. Cells double labeled with sox10:mRFP and fli1a:EGFP transgenic reporters (highlighted in gray) represent cranial neural crest populations from the frontonasal region (Fn), anterior pharyngeal arches 1 (1) and 2 (2), and posterior pharyngeal arches. (B) UMAP plots for DMSO or YM-treated samples. Clusters analyzed in this study are labeled with the NCC populations they represent. Clusters 5-11 are described further in Fig. S3 and Table S1. Equivalent clusters between DMSO and YM-treated samples are labeled with the same colors. (C) Feature map highlighting approximate cell populations in the intermediate domains of pharyngeal arches 1 and 2, shown overlaid on combined UMAP plots of control and YM-treated samples. The feature map represents the composite average expression level for 14 experimentally verified intermediate domain patterning genes: ccn2b, dlx3b, dlx4a, dlx4b, emx2, fgfbp2a, foxc1b, foxd1, fsta, grem2b, igfbp5b, msx1a, nkx3-2 and shox (see also Fig. S4). The scale is average expression. (D) Dot plot of selected marker genes and their respective cluster identity (Fig. S3). (E-G) Feature maps highlighting differential expression of dlx4b (E), dlx5a (F) and nr2f5 (G) in DMSO or YM-treated samples. The scale is average expression. (H-K′) Fluorescence in situ hybridization and immunofluorescence of 36 hpf embryos treated with DMSO or YM from 16 to 36 hpf. DMSO (H,H′,J,J′) or YM-treated (I,I′,K,K′) embryos were probed for dlx4b (H-I′) or dlx5a (J-K′) using fluorescence in situ hybridization (magenta). Pharyngeal arches, labeled with fli1a:EGFP, were detected with immunofluorescence (green). Approximate borders for pharyngeal arches 1 and 2 are indicated with dashed lines (H′,I′,J′,K′). Images are representative of four embryos. Scale bar: 50 μm.
|
