
Fig. 7
- ID
- ZDB-FIG-250501-17
- Publication
- Tavano et al., 2025 - BMP-dependent patterning of ectoderm tissue material properties modulates lateral mesendoderm cell migration during early zebrafish gastrulation
- Other Figures
- All Figure Page
- Back to All Figure Page
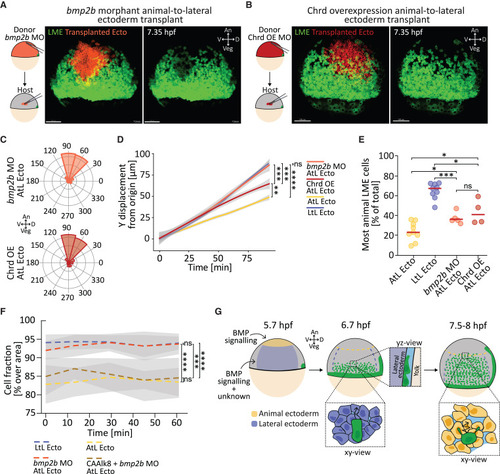
BMP signaling is needed for animal ectoderm blocking animal-pole-directed lateral mesendoderm migration (A) bmp2b morphant (MO) animal-to-lateral (AtL) ectoderm transplant assay. On the left, schematic representation of the experimental setup. On the right, fluorescence images of lateral mesendoderm (LME) cells and transplanted bmp2b MO animal ectoderm (bmp2b MO AtL Ecto, orange, lateral view) from a representative time-lapse video ∼70 min after the start of LME migration (∼7.35 hpf). Green, eGFP (LME cells); orange, membrane RFP (bmp2b MO AtL Ecto). 2 min 14 s frame rate, t0 ∼6.2 hpf. Scale bar, 100 μm. An, animal; Veg, vegetal; D, dorsal; V, ventral. See also Figure S5 and Video S12. (B) Chordin-overexpressing (Chrd OE) AtL ectoderm transplantation assay. On the left, schematic representation of the experimental setup. On the right, fluorescence images of LME cells and Chrd OE animal ectoderm (Chrd OE AtL Ecto, cardinal red, lateral view) from representative time-lapse movies ∼70 min after the start of LME migration (∼7.35 hpf). Green, eGFP (LME cells); cardinal red, 10,000 MW Alexa Fluor 647 dextran (Chrd OE AtL Ecto). ∼2 min 12 s frame rate, t0 ∼6.2 hpf. Scale bar, 100 μm. See also Figure S5 and Video S12. (C) Migration directionality of LME cells in bmp2b MO AtL Ecto (orange) and Chrd OE AtL Ecto (cardinal red) embryos. Number of cells, 199 from 5 bmp2b MO AtL Ecto (orange), 240 from 4 Chrd OE AtL Ecto (cardinal red). (D) Displacement (y displacement) along the animal-vegetal (AnVeg) axis of LME cells over time in transplanted embryos. Solid line represents the mean; gray ribbon displays confidence interval. Number of cells: 199 from 5 bmp2b MO AtL Ecto (orange), 240 from 4 Chrd OE AtL Ecto (cardinal red), 327 from 9 animal-to-lateral ectoderm transplants (AtL Ecto, yellow), 327 from 9 AtL Ecto (yellow), 327 from 9 LtL Ecto (blue). Dataset for AtL Ecto and LtL Ecto corresponds to data shown in Figure 3. Statistical test on the final y displacement, Mann-Whitney test: ns, not significant; ∗∗p < 0.01, ∗∗∗p < 0.001, ∗∗∗∗p < 0.0001. See also Figure S5. (E) Percentage of most animally migrating LME cells (for definition see Figure S3) in transplanted embryos. Red line represents the median. Number of embryos: 5 for bmp2b MO AtL Ecto (orange), 4 for Chrd OE AtL Ecto (cardinal red), 9 for AtL Ecto (yellow), 9 for LtL Ecto (blue). Datasets for AtL Ecto and LtL Ecto correspond to data shown in Figure 3. Statistical test, Mann-Whitney test: ns, not significant; ∗p < 0.05, ∗∗∗p < 0.001. See also Figure S5. (F) Cell fraction in bmp2b MO AtL Ecto or bmp2b MO co-injected with constitutively active Alk8 AtL ectoderm transplants (CAAlk8 + bmp2b MO AtL Ecto). Values are shown as mean (dashed line) with SD (light-gray area). Number of embryos: 6 for bmp2b MO AtL Ecto (orange), 12 for CAAlk8 + bmp2b MO AtL Ecto (gold), 11 for AtL Ecto (yellow), 12 LtL Ecto (blue). Datasets for AtL Ecto and LtL Ecto correspond to data shown in Figure 5. Statistical test, Mixed-effect analysis: ns, not significant; ∗∗∗∗p < 0.0001. (G) Schematic of ectoderm-dependent modulation on animal-pole-directed migration of LME cells. |