
Fig. 5
- ID
- ZDB-FIG-250501-15
- Publication
- Tavano et al., 2025 - BMP-dependent patterning of ectoderm tissue material properties modulates lateral mesendoderm cell migration during early zebrafish gastrulation
- Other Figures
- All Figure Page
- Back to All Figure Page
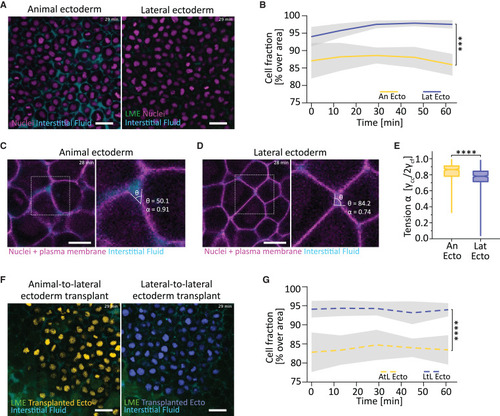
Lateral ectoderm and animal ectoderm display different cell fractions (A) Fluorescence images of animal (left) and lateral (right) ectoderm. Images are maximum-intensity projection of stacks of three 1-μm optical sections (z-step size, 1.5 μm). Green, eGFP (lateral mesendoderm [LME] cells); magenta, H2A-mCherry (nuclei); cyan, Alexa Fluor 647 dextran (interstitial fluid). Scale bar, 25 μm. See also Figure S4 and Video S9. (B) Cell fraction in the animal and lateral ectoderm. Values are shown as mean (solid line) with SD (light-gray area). Number of embryos: animal ectoderm (An Ecto, yellow), 5; lateral ectoderm (Lat Ecto, blue), 5. Statistical test, two-way ANOVA: ∗∗∗p < 0.001. See also Figure S4 and Video S7. (C and D) Fluorescence images of animal (An Ecto, C) and lateral (Lat Ecto, D) ectoderm. Dashed area demarcates the area shown in the respective right panels with exemplary contact angles (θ) used to determine the relative cell tension (α). Images are single 1-μm-thick optical sections. Magenta, H2B-mCherry and membrane RFP (nuclei and cell membrane); cyan, Alexa Fluor 647 dextran (interstitial fluid). Scale bar, 10 μm. (E) Relative cell tension (α) in the animal and lateral ectoderm 28 min after the onset of LME migration (∼6.2 hpf). Number of contact angles: 574 from 3 An Ecto (yellow), 589 from 3 Lat Ecto (blue). Statistical test, Mann-Whitney test: ∗∗∗∗p < 0.0001. (F) Fluorescence images of animal-to-lateral (AtL Ecto, yellow, left) and lateral-to-lateral (LtL Ecto, blue, right) ectoderm transplants. Images are maximum-intensity projection of stacks of three 1-μm optical sections (z-step size, 1.5 μm). Green, eGFP (LME cells); yellow, H2A-mCherry (nuclei, AtL Ecto); blue, H2A-mCherry (nuclei, LtL Ecto); cyan, Alexa Fluor 647 dextran (interstitial fluid). Scale bar, 25 μm. See also Figure S4 and Video S9. (G) Cell fraction in AtL and LtL ectoderm transplants. Values are shown as mean (dashed line) with SD (light-gray area). Number of embryos: 11 AtL Ecto (yellow), 12 LtL Ecto (blue). Statistical test, mixed-effect analysis: ∗∗∗∗p < 0.0001. |