
Fig. 1
- ID
- ZDB-FIG-250501-11
- Publication
- Tavano et al., 2025 - BMP-dependent patterning of ectoderm tissue material properties modulates lateral mesendoderm cell migration during early zebrafish gastrulation
- Other Figures
- All Figure Page
- Back to All Figure Page
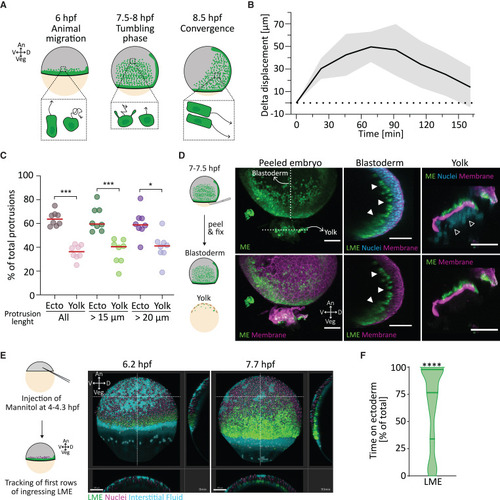
Ectoderm is the primary substrate for lateral mesendoderm animal migration (A) Schematic representation of lateral mesendoderm (LME) migration during zebrafish gastrulation. An, animal; Veg, vegetal; D, dorsal; V, ventral; hpf, hours post fertilization. (B) Delta displacement along the animal-vegetal (AnVeg) axis of the LME front over time. Values are shown as mean (solid black line) with standard deviation (SD, light-gray area). Dotted line represents 0 μm on the y axis. Number of embryos, 11. See also Figure S1 and Video S1. (C) Directionality of LME actin-positive protrusions during animal migration. Scatter dotplot shows the mean percentages of total protrusions of each cell during migration oriented either toward the ectoderm (Ecto) or yolk cell (YC) membrane (Yolk). Red line represents the median. Protrusion length is quantified from the cell center. Number of cells, 8; number of embryos, 2. Total number of protrusions: all, 2,778 (14.1 ± 1.6 SD protrusions per cell per frame [pcpf]); total length from the cell center >15 μm, 1,119 (5.6 ± 1.1 SD pcpf); total length from the cell center >20 μm, 437 (2.2 ± 1.1 SD pcpf). ∼2 min 14 s frame rate, t0 ∼6.2 hpf. Statistical test, Mann-Whitney test: ∗∗∗p < 0.001, ∗p < 0.05. See also Video S2. (D) Yolk-peeling assay. Left: schematic representation of the yolk-peeling assay. Right: maximum-intensity projection of a representative peeled embryo (208 optical sections; z thickness, 2 μm; z step, 1.5 μm). White dashed lines indicate the position of the cross-sections of blastoderm (middle) and yolk (right). Each cross-section is a maximum-intensity projection of 12 optical sections (z thickness, 2 μm; z step, 1.5 μm). Filled arrowheads point at the LME adhering to the blastoderm in absence of the YC membrane. Empty arrowheads point at the yolk syncytial layer (YSL) nuclei. Green, eGFP (mesendoderm, ME or LME); magenta, mCherry (membrane); cyan, DAPI (nuclei). Scale bar, 100 μm (E) Mannitol-induced detachment of the blastoderm from the yolk. Left: schematic representation of the experimental setup. Right: still images of LME cells (lateral view) from a representative time-lapse video at the start (left, 6.2 hpf) and end (right, 7.7 hpf) of the migration period. White dashed lines indicate the position of the yz (right) and xz (bottom) cross-sections. Green, eGFP (LME cells); magenta, H2A-mCherry (nuclei); cyan, Alexa Fluor 647 dextran (interstitial fluid). ∼2 min frame rate. Scale bar, 100 μm. See also Video S3. (F) Time the LME cells use the ectoderm as substrate for migration. Data are shown as percentage of the total time of migration. Number of cells, 163; number of embryos, 3. Statistical test, one-sample Wilcoxon test: ∗∗∗∗p < 0.0001. |