
Fig. 3
- ID
- ZDB-FIG-250501-13
- Publication
- Tavano et al., 2025 - BMP-dependent patterning of ectoderm tissue material properties modulates lateral mesendoderm cell migration during early zebrafish gastrulation
- Other Figures
- All Figure Page
- Back to All Figure Page
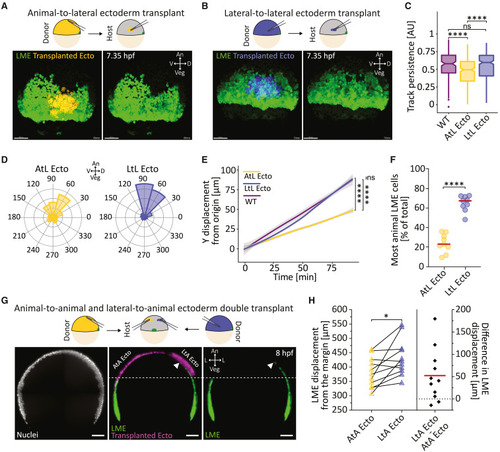
Ectoderm modulates lateral mesendoderm animal migration (A and B) Animal-to-lateral (AtL heterotypic) (A) and lateral-to-lateral (LtL homotypic) (B) ectoderm transplantation assay. Upper: schematic representation of the experimental setup. Lower: fluorescence images of lateral mesendoderm (LME) cells and transplanted animal (AtL Ecto, yellow, A) or lateral (LtL Ecto, blue, B) ectoderm (lateral view) from representative time lapses ∼70 min after the start of LME migration (∼7.35 hpf). Green, eGFP (LME cells); yellow, membrane RFP (AtL Ecto); blue, membrane RFP (LtL Ecto). Scale bar, 100 μm. An, animal; Veg, vegetal; D, dorsal; V, ventral. See also Video S5. (C) Migration persistence of LME cells in transplanted versus non-transplanted wild-type (WT) embryos. Number of cells: 173 from 3 WT (purple), 327 from 9 AtL Ecto (yellow), 327 form 9 LtL Ecto (blue). Statistical test, Mann-Whitney test: ns, not significant; ∗∗∗∗p < 0.0001. See also Figure S3. (D) Migration directionality of LME cells in transplanted embryos. Number of cells, 327 from 9 AtL Ecto (yellow); 327 from 9 LtL Ecto (blue). See also Figure S3. Dataset for WT in (C) and (D) corresponds to data shown in Figure S1. (E) Displacement (y displacement) of LME cells along the animal-vegetal (AnVeg) axis over time in transplanted versus WT embryos. Solid line represents the mean; gray ribbon displays confidence interval. Number of cells, 173 from 3 WT (purple), 327 from 9 AtL Ecto (yellow), 327 from 9 LtL Ecto (blue). Statistical test on the final y displacement, Mann-Whitney test: ns, not significant; ∗∗∗∗p < 0.0001. See also Figure S3. (F) Percentage of most animally migrating LME cells (for definition see also Figure S3) in transplanted embryos. Red line represents the median. Number of embryos, 9 AtL Ecto (yellow) and 9 LtL Ecto (blue). Statistical test, Mann-Whitney test: ∗∗∗∗p < 0.0001. (G) Animal-to-animal (homotypic, AtA Ecto) and lateral-to-animal (heterotypic, LtA Ecto) ectoderm double-transplantation assay. Upper: schematic representation of the experimental setup. Lower: maximum-intensity projection of ten lateral-to-lateral optical sections (z thickness: 4 μm; z step: 2 μm) showing the fluorescent signal of LME cells (green) in a double-transplanted embryo. AtA Ecto on the left, LtA Ecto on the right. Green, eGFP (LME cells); magenta, membrane RFP/H2B-mCherry (transplanted ectoderm from donor embryos); gray, DAPI (nuclei). Dashed line, extent of LME migration on the AtA Ecto side; full white arrowhead, extent of LME migration on the LtL Ecto side. L, lateral. Scale bar, 100 μm. (H) Difference in LME displacement along the AnVeg axis at 8 hpf in double-transplanted embryos. Left: displacement of the LME front (left y axis). Values are shown as median (triangles). Contralateral sides of the same embryos are connected by a black line. Yellow, AtA Ecto; blue, LtA Ecto. Right: difference in LME displacement from the margin (right y axis). Diamonds represent the difference of LME displacement between the AtA Ecto and LtA Ecto sides for each embryo. Red line represents the median. Number of embryos, 11. Statistical test, Paired t test: ∗p < 0.05. |