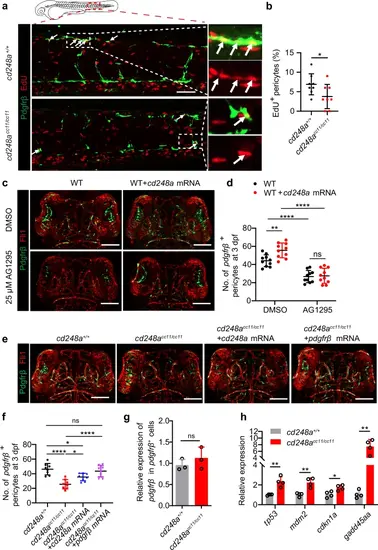
cd248a regulates pericyte proliferation in a Pdgfrβ function-dependent manner.a Confocal micrograph showing pericytes (pdgfrβ+ cells, green) and EdU staining (red) in cd248a+/+ and cd248acc11/cc11 larvae. Arrows indicate EdU-positive pericytes. Scale bar = 50 μm. b Quantification of the percentage of EdU-positive pericytes at 3 dpf, represented as the ratio of the number of EdU-positive pericytes to the total number of pericytes within the imaging area (n = 8 embryos). Confocal micrograph (c) and quantification (d) of brain pericytes at 3 dpf in WT and cd248a-overexpressing groups with or without exposure to AG1295 (n = 10 embryos). Scale bar = 100 μm. Confocal micrograph (e) and quantification (f) of brain pericytes at 3 dpf in cd248a+/+ and cd248acc11/cc11 groups with or without mRNA injection (n = 8 embryos). Scale bar = 100 μm. g Relative expression levels of pdgfrβ in pdgfrβ+ cells isolated from cd248a+/+ and cd248acc11/cc11 larvae (n = 3 biologically independent experiments). h Relative expression levels of cell cycle arrest-related genes in pericytes isolated from cd248a+/+ and cd248acc11/cc11 larvae (n = 4 biologically independent experiments). Data in all quantitative panels are presented as mean ± SD; two-tailed unpaired t test (b, g, h), one-way ANOVA (f) and two-way ANOVA (d). *, p < 0.05. **, p < 0.01. ****, p < 0.0001. ns: no significance.
|
