|
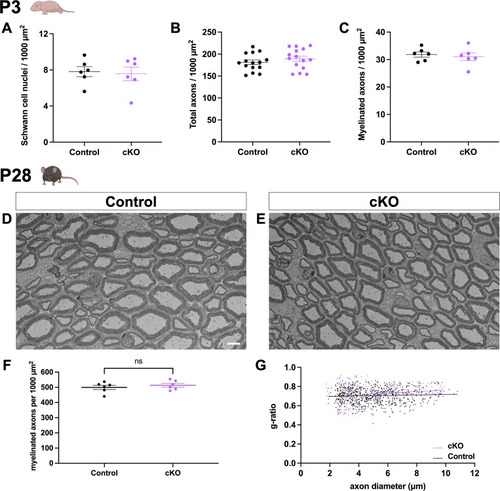
The myelin phenotype observed in Dock1 MUTs at P3 resolves by P28. (A–C) Quantifications obtained from analyzing P3 TEM micrographs showing the number of SC nuclei, the total number of axons, and the number of myelinated axons (see Fig. 3). None of these analyses revealed significant differences between control and cKO mice at P3. (D and E) TEM micrographs of control and Dock1 cKO sciatic nerves at P28. (F and G) Quantifications of myelinated axon count and g-ratios obtained from P28 TEM micrographs reveal no significant differences. n = 6 animals per genotype. (D and E) Scale bar = 4 µm. (A–C and F) Unpaired t test with Welch’s correction. ns, not significant.
|