|
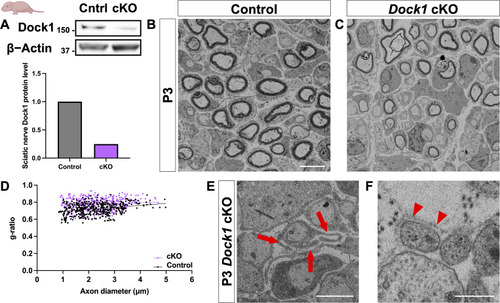
SC-specific Dock1 MUTs present with multiple defects in peripheral nerves. (A) Western blot (kD) showing sciatic nerve Dock1 and β-actin protein levels from control and Dock1 cKO animals and quantification of normalized protein levels. (B and C) TEM micrographs of sciatic nerves from DhhCre+;Dock1+/+ control and littermate DhhCre+;Dock1fl/fl cKO mice at P3. (D) Quantification of the g-ratio as it relates to axon caliber, n = 6 mice, 4 images per nerve (WT); 6 mice, 4 images per nerve (cKO). (E)Dock1 cKO MUT SCs display abnormal cytoplasmic protrusions that extend in multiple directions (red arrows). (F) Trails of basal lamina found in Dock1 cKO MUTs are observed in regions devoid of SC cytoplasm (red arrowheads). (B and C) Scale bar = 4 µm. (E and F) Scale bar = 1 µm. Source data are available for this figure: SourceData F3.
|