|
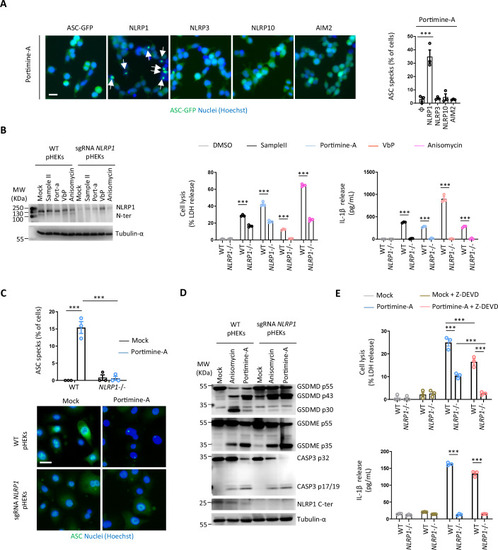
Portimine A activates the NLRP1 inflammasome in human skin epithelial cells. (A) Fluorescence micrographs and associated quantifications of ASC-GFP specks in HEK293T cells individually expressing or not NLRP1, NLRP3, NLRP10 or AIM2 exposed to 4 ng/mL of Portimine A for 8 h. ASC-GFP (green) pictures were directly taken after adding Hoechst (nuclei staining). Images shown are from one experiment and are representative of n = 3 independent experiments. Scale bar, 10 µm. The percentage of ASC complex was performed by determining the ratios between cells positive for ASC speckles and the total of cell nuclei (Hoechst). At least ten fields from each experiment were analyzed. Values are expressed as mean ± SEM. ***P ≤ 0.0001, one-way ANOVA. (B) Immunoblotting characterization of the NLRP1 genetic knockdown (CRISPR-Cas9) and of the subsequent cell lysis (LDH) and IL-1β release in pHEKs exposed or not to Sample II (1/20,000 dilution), Portimine A (4 ng/mL), ValboroPro (VbP, 10 µM) or Anisomycin (1 µM) for 24 h. For Cell lysis and cytokine release, ***P ≤ 0.0001, two-way ANOVA with multiple comparisons. Values are expressed as mean ± SEM. Immunoblot is one experiment representative of three independent experiments. Graphs show one experiment performed in triplicates at least three times. (C) Fluorescence micrographs and associated quantifications of ASC specks in pHEKs and NLRP1-deficient pHEKs generated in (B) and exposed or not to Portimine A (4 ng/mL) for 24 h. Hoechst (nuclei staining), ASC (anti-ASC antibody, green). Images shown are from one experiment and are representative of n = 3 independent experiments. Scale bar, 10 µm. The percentage of ASC complex was performed by determining the ratios between cells positive for ASC speckles and the total of cell nuclei (Hoechst). At least ten fields from each experiment were analyzed. Values are expressed as mean ± SEM. ***P ≤ 0.0001, one-way ANOVA. (D) Immunoblotting of GSDMD, GSDME, Caspase-3, NLRP1 (C-term part) and tubullin in pHEKs and NLRP1-deficient pHEKs (generated in (B)) after 24 h exposure to Portimine A (4 ng/mL) or to the known RSR inducer Anisomycin (1 µg/mL). Immunoblots show lysates from one experiment performed at least two times. (E) Cell lysis (LDH) and IL-1β release evaluation in pHEKs and NLRP1-deficient pHEKs upon pure Portimine A (4 ng/mL) or Anisomycin (1 µg/mL) exposure for 24 h. When specified, the Caspase-3 inhibitor (Z-DEVD, 20 µM) was used. ***P ≤ 0.0001, two-way ANOVA with multiple comparisons. Values are expressed as mean ± SEM. Graphs show one experiment performed in triplicates at least three times. Source data are available online for this figure.
|