
Fig. 4
- ID
- ZDB-FIG-250305-32
- Publication
- Hundsdorfer et al., 2025 - ERK activation waves coordinate mechanical cell competition leading to collective elimination via extrusion of bacterially infected cells
- Other Figures
- All Figure Page
- Back to All Figure Page
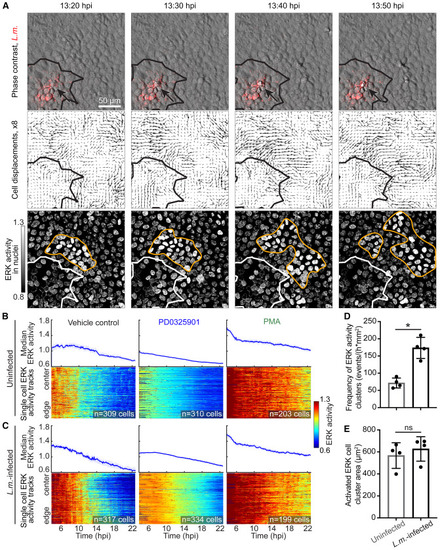
ERK inhibition or constitutive activation abolishes ERK activation waves traveling between MDCK cells during L.m. infection (A) Representative time-lapse images (columns) of L.m.-infected MDCK cells monolayers when extrusion of infected cells first occurs. Rows: overlay of phase contrast and L.m. fluorescence (red), cell displacements (arrows, scaled 8x), ERK activity in cell nuclei with orange outline indicating ERK activity wave. Black/white outlines: infection focus contour. Arrows point on first extruded infected cell. (B and C) Median (top) and heatmap plots (bottom) of ERK activity over time for uninfected (B) and L.m.-infected (C) MDCK cells monolayers treated with vehicle control (left), 50 μM PD0325901 (middle), or 200 nM PMA (right). Heatmap plots show individual cells’ ERK activity over time (h or hpi), and cells are ordered as a function of distance from the center of the field of view (for uninfected) or the infection focus center (infected). (D and E) Bar plots of mean frequency of ERK waves (events/(h⋅mm2), (D) and ERK-activated cell cluster area (μm2, (Ε) for uninfected and L.m.-infected MDCK cell monolayers. N = 4 independent experiments, the median of which is shown as a circle overlayed on the box plot. Lines: mean ± SD, WRST: ∗p < 0.05, ns:p > 0.05. See also Figure S4 and Video S3. |