
Fig. 3
- ID
- ZDB-FIG-250305-31
- Publication
- Hundsdorfer et al., 2025 - ERK activation waves coordinate mechanical cell competition leading to collective elimination via extrusion of bacterially infected cells
- Other Figures
- All Figure Page
- Back to All Figure Page
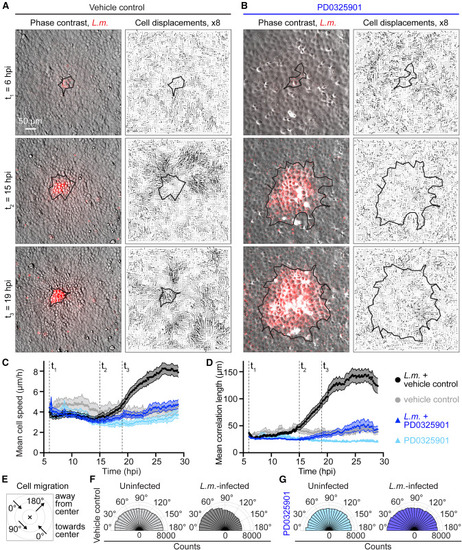
ERK inhibition stalls the increase in cell speed and coordinated migration of MDCK cells during L.m. infection (A and B) Representative video microscopy images of L.m.-infected MDCK cell monolayers treated with vehicle control (A) or 50 μM PD0325901 (B) at three indicated time points (rows). Columns: overlay of phase-contrast image with L.m. fluorescence, cell displacements (arrows, scaled 8x). Black outline: infection focus contour. (C and D) Mean cell speed (μm/h, C) and correlation length (μm, D) over time (hpi) shown for uninfected or L.m.-infected cells treated or not at 4 hpi with 50 μM PD0325901 (see color legend). Solid line: mean, shaded area: SEM for three independent experiments, N = 7 and N = 18 recordings for uninfected and L.m.-infected conditions, respectively. Dashed lines indicate representative time points shown in (A-B). (E) Sketch of cell migration directionality angles quantified in (F-G). 0o and 180o correspond to cells moving toward or away from the center of the infection focus (or field of view for uninfected cells), respectively. (F and G) Rose plots showing cell displacement directionality angle (angle between radial direction and cell displacement, see STAR Methods) for uninfected (left) or L.m.-infected cells in monolayer (right), treated with vehicle control (F) or 50 μM PD0325901 (G). See also Figure S3 and Video S2. |