
Fig. 1
- ID
- ZDB-FIG-250305-29
- Publication
- Hundsdorfer et al., 2025 - ERK activation waves coordinate mechanical cell competition leading to collective elimination via extrusion of bacterially infected cells
- Other Figures
- All Figure Page
- Back to All Figure Page
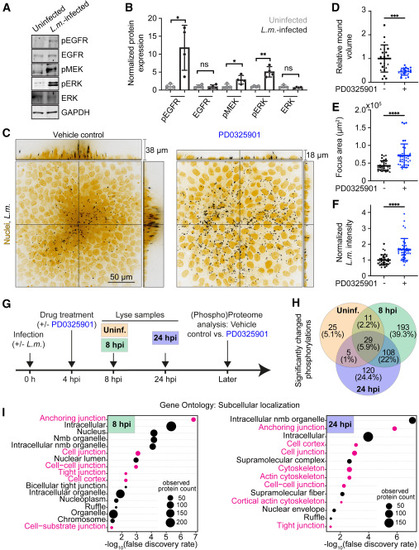
ERK activation increases in host cells during L.m. infection and is required for mound formation (A) Representative cropped western blots from lysates of uninfected and L.m.-infected MDCK cell monolayers at 24 hpi. Total or phosphorylated levels (p) of the indicated proteins were probed for pEGFR, EGFR, pMEK, pERK, ERK, and GAPDH. (B) Bar plots of relative expression of proteins probed in (A). Measurements normalized to GAPDH expression of each condition and expressed as fold change relative to mean uninfected cells’ expression level. Lines: mean ± SD, unpaired t test: ∗p < 0.05, ∗∗p < 0.01. (C) Orthogonal views of L.m.-infected MDCK cells at 24 hpi treated with vehicle control (left) or 50 μM PD0325901 (right) at 4 hpi. Host nuclei: yellow; L.m.: black. (D–F) Quantification of L.m. infection focus properties of the conditions shown in (C): (D) relative mound volume, (E) focus area (μm2), (F) relative L.m. fluorescence intensity. D, F normalized to mean of control cells. Lines: mean ± SD, WRST: ∗∗∗p < 0.001, ∗∗∗∗p < 0.0001; different shapes indicate data from N = 3 independent experiments. (G) Sketch of phosphoproteomics experimental setup. Uninfected samples (orange) or L.m.-infected samples at 8 (green) and 24 (blue) hpi treated with vehicle control or PD0325901 are compared. (H) Venn diagram displaying the number and percentage of significantly changed protein phosphorylation levels comparing control to PD0325901-treated cell samples as explained in (G). (I) Functional enrichment analysis of differentially phosphorylated proteins of samples shown in (G), displaying in bubble plots the GO cellular components significantly altered between control versus PD0325901-treated samples. Cell-mechanics-related GO components are in magenta. Left: L.m.-infected for 8 h, right: L.m.-infected for 24 h. See also Figure S1, Video S1, and Table S1. |