|
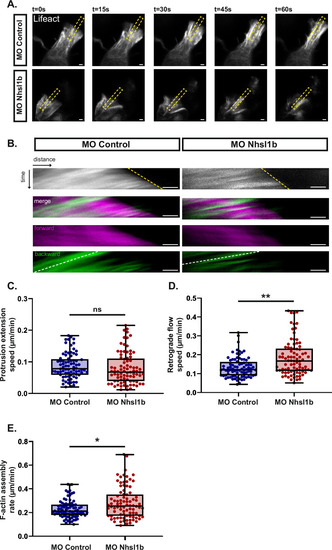
nhsl1b knockdown increases F-actin retrograde flow and assembly rate. A Selected time points from a high temporal resolution time-lapse showing growing protrusions in MO Control and MO Nhsl1b injected mesodermal cells expressing Lifeact-mNeongreen. Dashed yellow box indicate the regions used to generate the kymographs in (B). B Kymographs colour-coded to highlight the forward and backward moving pixels. The yellow dashed line corresponds to the extending front of the protrusion, the white dashed line corresponds to the actin retrograde flow. Quantification of the protrusion extension speed (C), retrograde flow speed (D), and F-actin assembly rate (E). Likelihood ratio test of a linear mixed effects model with treatment as a fixed effect and cells as a random effect against a model without the fixed effect. p-values: (C) MO Control vs MO Nhsl1b: 0,8362 ns.; (D) MO Control vs MO Nhsl1b: 0.0051**; (E) MO Control vs MO Nhsl1b: 0.0248*. MO Control (n = 84 cells in 14 embryos) and MO Nhsl1b (n = 89 cells in 17 embryos). Scale bars 2 µm.
|