|
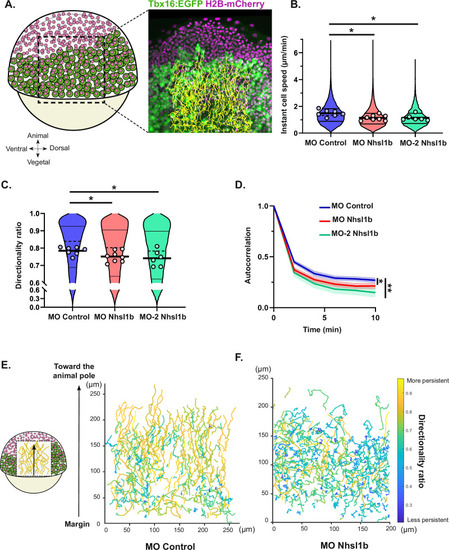
nhsl1b knockdown reduces cell speed and persistence. A Representative image of mesodermal cell nuclei tracking, in a Tg(tbx16:EGFP) embryo expressing H2B-mCherry. B, C Instant cell speed and directionality ratio. Circles on the violin plot indicate mean per embryo. Likelihood ratio test of a linear mixed effects model with treatment as a fixed effect and embryos as a random effect against a model without the fixed effect. Adjusted p-values: (B) MO Control vs MO Nhsl1b: 0.0100 *; MO Control vs MO-2 Nhsl1b: 0.0131 *; (C) MO Control vs MO Nhsl1b: 0.0301 *; MO Control vs MO-2 Nhsl1b: 0.0301 *. D Directional autocorrelation. Likelihood ratio test of a non-linear mixed effects model (see methods) with treatment as a fixed effect and embryos as a random effect against a model without the fixed effect. Adjusted p-values: MO Control vs MO Nhsl1b: 0.045 *; MO Control vs MO-2 Nhsl1b: 0.0054 *. MO control (n = 5), MO Nhsl1b (n = 8) and MO-2 Nhsl1b (n = 6) injected embryos. E, F Representative cell trajectories of mesodermal cells in MO control and MO Nhsl1b injected embryos, colour-coded for cell migration persistence (directionality ratio). x-axis represents distance along the dorsal-ventral axis, y-axis represents distance along the animal-vegetal axis.
|