|
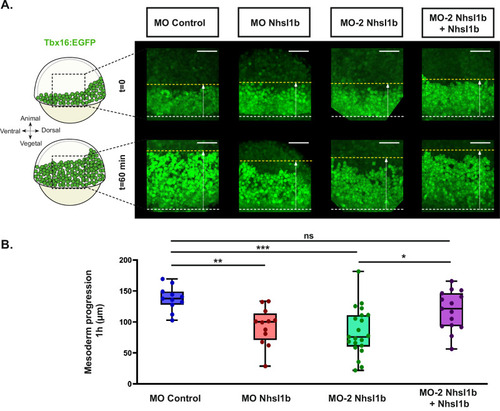
nhsl1b knockdown affects lateral mesoderm migration. A Representative lateral views of Tg(tbx16:EGFP) embryos, at early gastrulation (60% epiboly; t = 0) and 1 hour later, in different conditions. White dashed lines indicate the position of the margin of the blastoderm, yellow dashed lines indicate the position of the front of the migrating mesoderm. Mesoderm progression was measured as the variation in distance between these two lines (see also Supplementary Fig. S1). Scale bar 100 µm. B Quantification of the lateral mesoderm progression in MO Control injected embryos (n = 11 embryos), MO Nhsl1b injected embryos (n = 12 embryos), MO-2 Nhsl1b injected embryos (n = 21 embryos), MO-2 Nhsl1b and nhsl1b mRNA co-injected embryos (n = 15 embryos). N = 16 experiments in total with more than 4 experiments per conditions. Kruskal–Wallis test followed by Dunn’s test. Adjusted p-values: MO Control vs MO Nhsl1b: 0.0093 **; MO Control vs MO-2 Nhsl1b 0.0002 ***; MO-2 Nhsl1b vs MO-2 Nhsl1b + Nhsl1b 0.0218 *; MO Control vs MO-2 Nhsl1b + Nhsl1b 0.6481 ns.
|