|
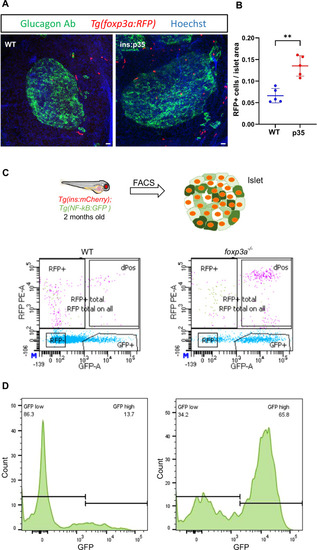
Zebrafish Tregs populate the islets of p35-expressing beta cells and regulate the levels of islet inflammation. (A) Representative confocal images (maximum projection) of primary islets from 6 months old WT and Tg(ins:p35) animals in the transgenic background of Tg(foxp3a:RFP). Immunostaining against glucagon marks the alpha cells (in green), Tg(foxp3a:RFP) marks the Tregs (in red), while Hoechst staining was done to label the nuclei (blue). Scale bar, 20 µm. (B) Quantification showing the number of RFP positive cells per unit islet area in WT and Tg(ins:p35). Error bars are mean ± SD from n = 5 independent samples per group. The horizontal bar represents the mean value. Unpaired two-tailed t-test with Welch’s correction, **P = 0.001. (C) Schematic showing the experimental setup for FACS. Beta cells from 2 months old WT and foxp3−/− mutants in the Tg(ins:mCherry);Tg(NF-kB:GFP) transgenic background were analysed using FACS for GFP expression. The data shows the results from the analysis of islets from n = 5 combined fish per group from two biological replicates. (D) FlowJo graph shows GFP intensity (along the X-axis) and the distribution of beta cells from WT and foxp3a−/− animals, respectively. Horizontal lines indicate the division point between GFPlow and GFPhigh levels. Percentage values represent the proportion of cells with GFPlow or GFPhigh expression. Source data are available online for this figure.
|