|
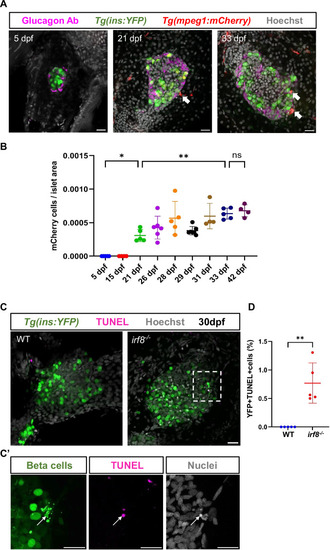
Macrophage colonization coincides with the onset of developmental beta-cell apoptosis, and their depletion reveals developmental beta-cell apoptosis. (A) Confocal images (single plane) of primary islets from Tg(ins:YFP); Tg(mpeg:mCherry) animals at 5, 21, and 33 dpf. Tg(ins:YFP) marks the beta cells (green), Tg(mpeg:mCherry) marks the macrophages (red), while immunostaining against glucagon labels the alpha cells (in magenta) present on the periphery of the islet. Macrophages (white arrows) are observed in contact with the islet at 21 dpf while they are absent at 5 dpf. At 33 dpf, macrophages have colonized the islet. Scale bar, 20 µm. (B) Quantification showing the number of mCherry-positive cells per unit area in the pancreatic islet at different stages of development. Error bars are mean ± SD from n = at least 4 independent samples per developmental time point. One-way ANOVA with Tukey’s multiple comparison test, *p = 0.0158, **p = 0.0088, ns not significant. (C) Confocal images (maximum projection) of primary islet from 30 dpf Tg(ins:YFP);irf8+/+ and Tg(ins:YFP);irf8−/− animals. Tg(ins:YFP) marks the beta cells (green), TUNEL staining labels the apoptotic cells (magenta), while Hoechst staining labels the nuclei (gray). White arrow points to TUNEL-positive beta cells. Scale bar, 20 µm. (C’) Insets show a high-magnification single plane with separate channels from the confocal stacks (corresponding to the area marked using a white dotted line in (C). Scale bar, 20 µm. (D) Quantification showing the percentage of YFP and TUNEL double-positive cells in the islet of Tg(ins:YFP);irf8+/+ and Tg(ins:YFP);irf8−/− animals. Error bars are mean ± SD from n = 5 independent samples per group. Unpaired two-tailed t-test with Welch’s correction, **p = 0.0081. Source data are available online for this figure.
|