|
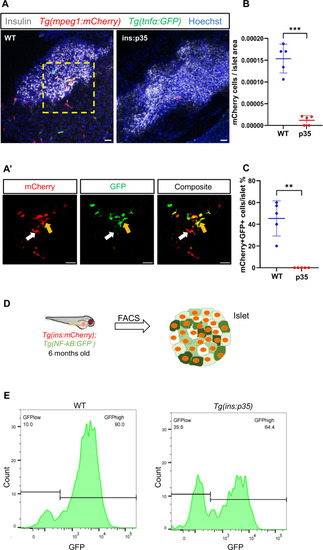
Beta-cell death regulates the islet’s immune component and inflammation. (A) Representative confocal images (maximum projection) of primary islets from 6 months old WT and Tg(ins:p35) animals in the transgenic background of Tg(mpeg:mCherry);Tg(tnfα:GFP). Immunostaining against insulin is used to label the beta cells (gray). Tg(mpeg:mCherry) reporter marks the macrophages (red), Tg(tnfα:GFP) marks the tnf-α expressing cells (green) while the nuclei are stained with Hoechst (blue). Scale bar 20 µm. (A’) Insets show high-magnification single planes from the confocal projection of the WT animal (corresponding to the area marked using a yellow dotted line in A). Scale bar, 20 µm. A subset of macrophages express tnf-α (yellow arrow) while others do not (white arrow). (B) Quantification showing the number of mCherry-positive cells per unit islet area in WT and Tg(ins:p35). Error bars are mean ± SD from n = 5 independent samples per group. The horizontal bar represents the mean value. Unpaired two-tailed t-test with Welch’s correction, ***P = 0.000494. (C) Quantification showing the percentage of mCherry and tnfα double-positive cells in the islet of WT and Tg(ins:p35) animals. Error bars are mean ± SD from n = 5 independent samples per group. The horizontal bar represents the mean value. Unpaired two-tailed t-test with Welch’s correction, **P = 0.003271. (D) Beta cells from 6 months old Tg(ins:mCherry);Tg(NF-kB:GFP) and Tg(ins:p35);Tg(ins:mCherry);Tg(NF-kB:GFP) animals were analysed using FACS. The data shows the results from the analysis of islets from n = 5 combined fish per group with two biological replicates. (E) The FlowJo graph shows GFP intensity (along the X-axis) and the distribution of beta cells from WT and Tg(ins:p35) animals, respectively. Horizontal lines indicate the division point between GFPlow and GFPhigh levels. Percentage values represent the proportion of cells with GFPlow or GFPhigh expression. Source data are available online for this figure.
|