|
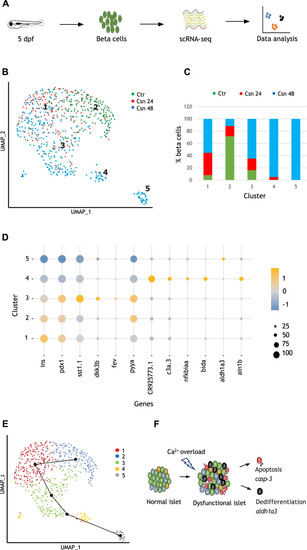
Beta cells experiencing Ca2+ excitotoxicity show transcriptional trajectories toward cell death or dedifferentiation. (A) Schematic of the experimental design. (B) Uniform manifold approximation and projection plot depicting clusters of beta cells from all three samples. Clusters are numbered and color-coded according to the legend shown at the right. (C) The color-coded bar graph represents the cluster-wise distribution of beta cells from the three samples. (D) Dot plot indicating the expression levels and the percentage of cells expressing selected genes in each of the five beta-cell clusters. The size of the dot represents the percentage of cells expressing the gene in a particular cluster, while the color scale represents average expression of the gene in the cluster after scaling. (E) Beta-cell trajectory as suggested by pseudotime analysis with slingshot. The line connects the beta-cell clusters starting from 2, 1, 3, 4, and 5. (F) A schematic representation of our model based on single-cell transcriptomics. When experiencing chronic Ca2+ excitotoxicity, beta cells can undergo a reduction of beta-cell markers such as ins and pdx1. Some beta cells succumb to the stress, expressing cell death genes such as casp-3 (cluster 4), while others go further down the dedifferentiation path, expressing aldh1a3 and evading cell death (cluster 5).
|