
Fig. 1
- ID
- ZDB-FIG-250203-40
- Publication
- Shi et al., 2025 - An animal model recapitulates human hepatic diseases associated with GATA6 mutations
- Other Figures
- All Figure Page
- Back to All Figure Page
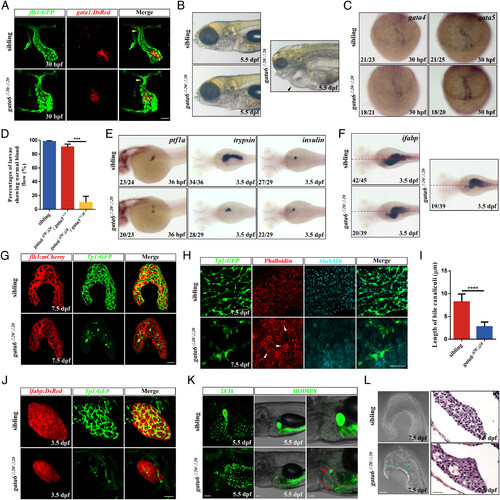
The knockout of gata6 causes various defects in zebrafish. (A) Tg(flk1:GFP) and Tg(gata1:DsRed) were used to label endocardium (green) and erythrocyte (red), respectively (n = 9 siblings, n = 10 gata6 mutants). Yellow arrowhead, the presumed outflow tract. (Scale bar, 50 μm.) (B) Brightfield views of the siblings and gata6 mutants at 5.5 dpf. Black arrowhead, pericardial edemas. (C) Analysis of gata4 and gata5 expression in the heart tube at 30 hpf. (D) Percentages of embryos with normal blood flow at 3 dpf (n = 328 siblings, n = 82 gata6Δ20/Δ20; gata5+/+, n = 108 gata6Δ20/Δ20; gata5+/Δ4). (E) WISH showing ptf1a (exocrine pancreatic progenitors), trypsin (exocrine pancreas), and insulin (β cell) expression at the indicated stages. (F) Expression of ifabp (intestinal epithelium) at 3.5 dpf. Red dashed lines, the midline. (G) Tg(flk1:mCherry) and Tg(Tp1:GFP) were used to reveal vascular network (red) and intrahepatic biliary network (green), respectively (n = 6 siblings, n = 4 gata6 mutants). (Scale bar, 50 μm.) (H) Immuno- and dye staining of livers in the siblings (n = 6) and gata6 mutants (n = 7) at 7.5 dpf. GFP (green), intrahepatic bile duct cells; Phalloidin (red), F-actin cytoskeleton enriched in bile canaliculi; Abcb11b (cyan), a bile salt export pump located in bile canaliculi. Phalloidin staining showed hepatic cysts (white arrowhead) in gata6 mutant livers. (Scale bar, 50 μm.) (I) Quantification of the length of bile canaliculi in the figure (H). Few abnormal bile canaliculi were detected in the gata6 mutant liver. (J) Confocal projection images showing the expression of Tg(lfabp:DsRed) and Tg(Tp1:GFP) in the liver at 3.5 dpf (n = 12 siblings, n = 9 gata6 mutants). (Scale bar, 50 μm.) (K) Confocal images of 2F11 antibody staining (n = 5 siblings, n = 5 gata6 mutants) or BODIPY-FL C5:0 feeding (n = 7 siblings, n = 11 gata6 mutants). Red asterisk, the gallbladder; Red arrowhead, BODIPY droplets. (Scale bar, 50 μm.) (L) Confocal projection images showing the morphology of the siblings (n = 5) and gata6 mutants (n = 5) livers. Green asterisk, hepatic cysts. (Scale bar, 50 μm.) Hematoxylin-eosin staining of the liver sections in the siblings (n = 4) and gata6 mutants (n = 4) at 7.5 dpf. Red asterisk, the cystic spaces. (Scale bar, 20 μm.) Data are mean ± SD, ***P < 0.001, ****P < 0.0001, two-tailed unpaired t test. |