
Fig. 4
- ID
- ZDB-FIG-241230-9
- Publication
- Saha et al., 2024 - Rab11-Rab8 cascade dynamics in primary cilia and membrane tubules
- Other Figures
- All Figure Page
- Back to All Figure Page
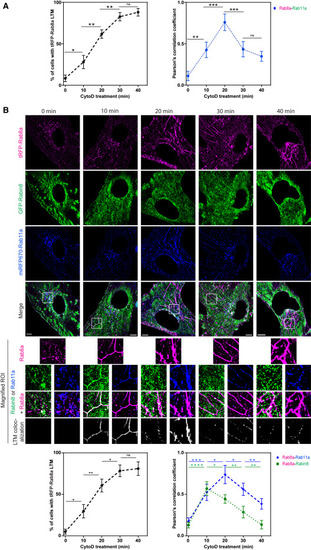
Membrane conversion protein dynamics of Rab11 and Rabin8 on Rab8 LTMs (A) (Left) Quantification of tRFP-Rab8a LTMs in RPE tRFP-Rab8a+GFP-Rab11a cells treated with Dox for 24 h (mean ± SEM for ∼100 cells from n = 3 experiments) imaged by Elyra 7 SIM2 (images in Figure S5). (Right) tRFP-Rab8a colocalization with GFP-Rab11a on LTMs (calculated from Pearson’s correlation coefficient). Mean ± SEM from n = 3 experiments where Pearson’s correlation coefficient was calculated from 3 areas of each cell with 5 cells analyzed per experiment. (B) Representative images of RPE tRFP-Rab8a+GFP-Rabin8+miRFP670-Rab11a treated with Dox for 24 h followed by CytoD and imaged on Elyra 7 SIM2. tRFP-Rab8a+GFP-Rabin8 and tRFP-Rab8a+miRFP670-Rab11a colocalization on LTMs from the magnified regions of interest are shown below. Bottom images: (left plot) quantification of tRFP-Rab8a LTMs, (right plot) Pearson’s correlation coefficient for tRFP-Rab8a colocalization with GFP-Rabin8 or miRFP670-Rab11a on LTMs as described in (A). ∗p < 0.05; ∗∗p < 0.001; ∗∗∗p < 0.0001; ∗∗∗∗p < 0.00001. Scale bar: 5 μm. |