
Fig. 6
- ID
- ZDB-FIG-241230-11
- Publication
- Saha et al., 2024 - Rab11-Rab8 cascade dynamics in primary cilia and membrane tubules
- Other Figures
- All Figure Page
- Back to All Figure Page
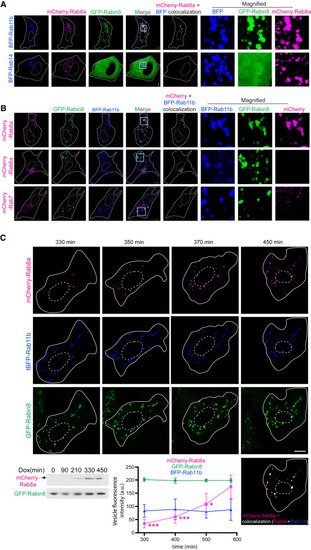
Rab8 is loaded onto enlarged Rabin8-Rab11 membranes (A) RPE cells transiently transfected with mCherry-Rab8a, GFP-Rabin8, and tBFP-Rab11b or BFP-Rab14 for 48 h. Representative images show a single xy-plane from a z stack captured on SDCM using a Hamamatsu Orca Flash4 camera. mCherry+tBFP colocalization is shown. (B) RPE GFP-Rabin8 cells transiently transfected with tBFP-Rab11b and mCherry-Rab8a, mCherry-Rab7 or mCherry-Rab6a for 48 h. Representative images show a single xy-plane from a z stack captured on SDCM with an EMCCD Evolve 512 camera. (C) RPE GFP-Rabin8+mCherry-Rab8a (Tet-inducible) cells transiently expressing tBFP-Rab11b and treated with Dox 24 h post-transfection imaged by time-lapse microscopy every 20 (representative images) or 25 min (plot). Representative images (top) show three-dimensional surface rendering of unfiltered z stack (step size, 1 μm) cell images for the time course. Image of BFP-Rab11b colocalization (white) with mCherry-Rab8a is shown at time point 450 min. Immunoblot shows expression of mCherry-Rab8a, detected with anti-Rab8 antibodies, and GFP-Rabin8, detected with GFP antibodies, following indicated Dox treatment times. Plot shows tBFP-Rab11b, mCherry-Rab8a, and GFP-Rabin8 fluorescence intensity in tBFP-positive vesicular structures (≥1 voxel) measured at the indicated times following Dox induction and plotted for five cells. Results shown as mean ± SD from two independent experiments. ∗p < 0.05; ∗∗∗p < 0.0001. Scale bar: 5 μm. |