
Fig. 2
- ID
- ZDB-FIG-241230-7
- Publication
- Saha et al., 2024 - Rab11-Rab8 cascade dynamics in primary cilia and membrane tubules
- Other Figures
- All Figure Page
- Back to All Figure Page
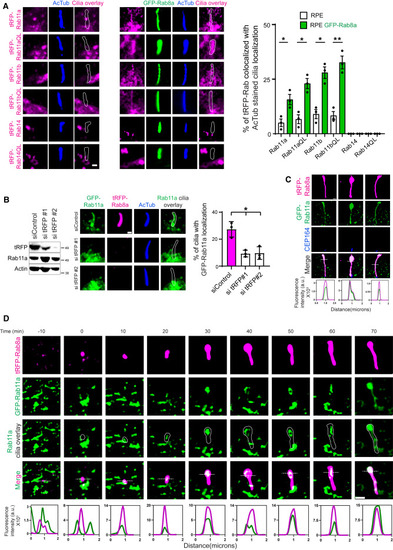
The Rab11-Rab8 cascade promotes Rab11 ciliary accumulation (A and B) Quantification of Rab8 effects on Rab11 ciliary localization. (A) Representative images of cilia in RPE (left) and RPE GFP-Rab8a (center) cells transiently transfected with tRFP-Rab WT and constitutively active (QL) proteins. (Right) Quantification of ciliary localization of tRFP-Rabs from cells starved for the last 12 h and stained with acetylated α-tubulin (AcTub) antibody showing mean ± SEM from >80 cells from n = 3 experiments. (B) RPE tRFP-Rab8a+GFP-Rab11a cells were treated with siControl and sitRFP for 72 h and Dox for 24 h. (Left) Immunoblot probed with tRFP, Rab11a, and actin antibodies. (Center and right) Cells were serum starved the last 12 h and stained with AcTub antibodies. GFP-Rab11a ciliary localization was detected by spinning disk confocal microscopy (SDCM). (Center) Representative images of ciliated cells from a single xy-plane of a z stack. (Right) Quantification of ciliary GFP-Rab11a showing mean ± SEM for ∼100 cells analyzed from n = 3 independent experiments. (C) Super-resolution imaging of Rab11 ciliary localization by Elyra 7 microscopy SIM2 in fixed RPE tRFP-Rab8a+GFP-Rab11a cells, treated with Dox for 24 h, serum starved the last 12 h, and stained with CEP164 antibody. Images shown are from a single xy-plane from a z stack. The lower image shows the fluorescence line profile plots of tRFP-Rab8a and GFP-Rab11a corresponding to the dotted line. (D) Super-resolution time-lapse imaging of Rab11 and Rab8 localization during ciliogenesis. Cells described in (B) were Dox treated for 24 h, serum starved for 3 h ,and then imaged live using the Elyra 7 microscope SIM2 every 10 min. Images shown are from a single xy-plane from a z stack. The lower image shows the fluorescence line profile plots as described in (C). Cilia are outlined in white. ∗p < 0.05; ∗∗p < 0.001. Scale bar: 1 μm. |