
Fig. 5
- ID
- ZDB-FIG-241230-10
- Publication
- Saha et al., 2024 - Rab11-Rab8 cascade dynamics in primary cilia and membrane tubules
- Other Figures
- All Figure Page
- Back to All Figure Page
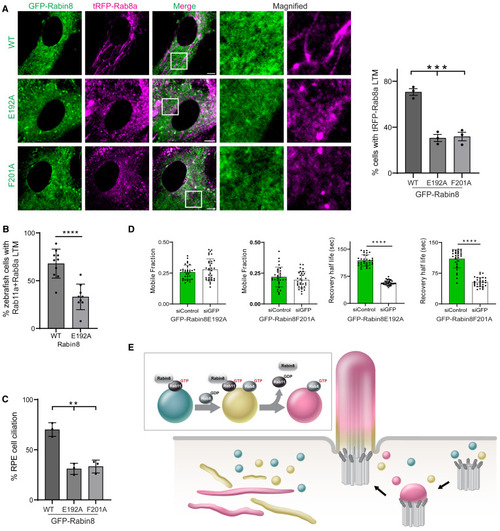
Rabin8 GEF activity is required for Rab8 LTM localization, ciliary trafficking, and ciliogenesis (A) (Right) Quantification of tRFP-positive LTMs in fixed RPE cells stably expressing tRFP-Rab8a and GFP-Rabin8 WT or GEF mutants (E192A and F201A) treated with Dox for 24 h, followed by CytoD for 30 min. (Left) Representative images from a single xy-plane of a z stack captured on an SDCM. Mean ± SEM for ∼100 cells from n = 3 experiments. (B) Quantification of mNeonGreen-Rab8a and mCherry-Rab11a colocalized on LTMs in yolk sac cells from 24 hfp zebrafish embryos co-injected with Rabin8 or Rabin8 E192A mRNA. Mean ± SEM for n = 10 (Rabin8) and n = 9 (Rabin8 E192A) independent experiments. (C) Quantification of ciliation in cells described in (A) following serum starvation for 24 h and stained with AcTub. Mean ± SEM for ∼100 cells from n = 3 experiments. (D) Quantification of FRAP recovery half-life and mobile fraction performed on cilia (∼5 μm) in RPE tRFP-Rab8a+GFP-Rabin8 E192A and RPE tRFP-Rab8a+GFP-Rabin8 F201A cells treated with siControl or siGFP for 72 h with Dox treatment and serum starvation for the last 24 h and 12 h, respectively. Mean ± SD from n = 3 independent experiments. (E) Model of Rab11-Rab8 cascade membrane conversion meditated by Rabin8. ∗p < 0.05; ∗∗p < 0.001; ∗∗∗p < 0.0001; ∗∗∗∗p < 0.00001. Scale bar: 5 μm. |