
Fig. 3
- ID
- ZDB-FIG-241230-8
- Publication
- Saha et al., 2024 - Rab11-Rab8 cascade dynamics in primary cilia and membrane tubules
- Other Figures
- All Figure Page
- Back to All Figure Page
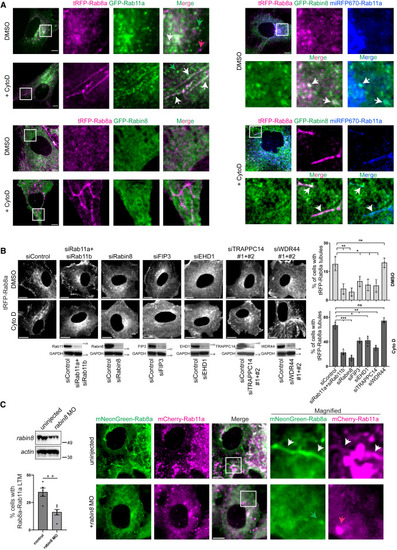
Rab11-Rab8 cascade association with Rab8 LTMs (A) Representative images of RPE tRFP-Rab8a+GFP-Rab11a, tRFP-Rab8a+GFP-Rabin8, and tRFP-Rab8a+GFP-Rabin8+miRFP670-Rab11a cells treated with Dox for 24 h and DMSO or CytoD for 30 min and imaged on an SDCM. Images shown are from a single xy-plane from a z stack. White arrows indicate colocalized vesicles or LTMs; green and magenta arrows indicate Rab11a and Rab8a vesicles that do not colocalize, respectively. (B) Quantification of tRFP-Rab8a LTMs in cells treated with siRNA for 72 h and Dox for the last 24 h, followed by DMSO or CytoD treatment for 30 min and imaged on SDCM. (Left) Representative single xy-plane image from a z stack of RPE tRFP-Rab8a treated with siRNA. (Right) Plot showing tRFP-Rab8a LTMs in cells treated with siRNA. Immunoblots (below immunofluorescence images) show protein expression from cell lysates stained with antibodies detecting actin and ablated proteins. Plot shows mean ± SEM for >100 cells from n = 3 independent experiments. (C) Characterization of Rabin8 dependence on Rab11-Rab8 colocalization on LTMs in zebrafish embryos. Immunoblot analysis (top left) of Rabin8 expression in 24 hpf MO-injected zebrafish embryos. Quantification of mNeonGreen-Rab8a+mCherry-Rab11a LTMs in embryos injected with mNeonGreen-Rab8a+mCherry-Rab11a with and without rabin8 MO (bottom left). Mean ± SEM for ∼100 cells analyzed per condition from n = 5 and 6 independent experiments for uninjected and rabin8 MO, respectively. (Right) Representative images captured on an SDCM is shown. White arrows indicate colocalized LTMs; green and magenta arrows indicate Rab8a and Rab11a vesicles that do not colocalize, respectively. ns, not significant; ∗p < 0.05; ∗∗p < 0.001; ∗∗∗p < 0.0001. Scale bar: 5 μm. |