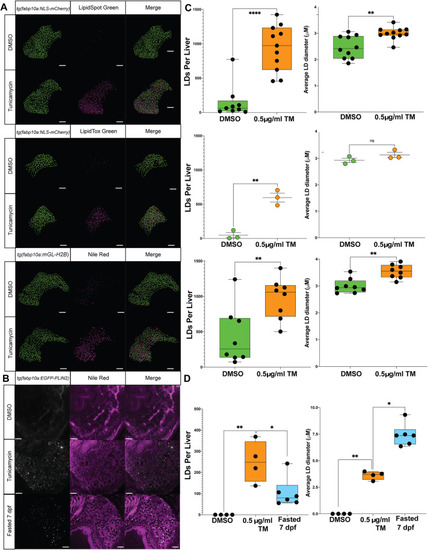
Quantitative hepatic LD analysis using LipidTox, LipidSpot and NR. (A) Representative Imaris-rendered confocal images of hepatocyte nuclei (green) and LDs (magenta) in zebrafish larvae treated with DMSO or 0.5 μg/ml TM from 96 to 128 hpf and stained with LipidSpot, LipidTox or NR. Transgenic lines to label hepatocyte nuclei were used in contrasting colours [i.e. Tg(fabp10a:NLS-mCherrry) and Tg(fabp10a:mGL-H2B)]. Scale bars: 50 μm. (B) Single confocal sections of fixed Tg(fabp10a:EGFP-PLIN2) larvae treated from 96 to 120 hpf with DMSO or TM, or maintained until 168 hpf as fasted samples, stained with NR. Scale bars: 20 μm. (C) Quantification of LD number and diameter in hepatocytes of zebrafish larvae stained with LipidSpot, LipidTox and NR as shown in A. Hepatic LDs for each larvae were detected to a depth of 100 μm (34 z-slices). Each datapoint represents a larva, and data are shown as median and interquartile range or mean and s.e.m. n>3. ns, not significant; **P<0.01, ****P<0.0001. Statistical analysis for LD number and size with two treatment groups was determined by unpaired two-tailed Student's t-test. (D) Quantification of LD number and diameter in hepatocytes of transgenic EGFP-PLIN2 zebrafish larvae as shown in B. Hepatic LDs were detected in a single z-plane in the left lobe of each larvae. Each datapoint represents a larva, and data are shown as median and interquartile range. n>4. *P<0.05, **P<0.01. Statistical analysis for LD number and size with two treatment groups was determined by unpaired two-tailed Student's t-test.
|
